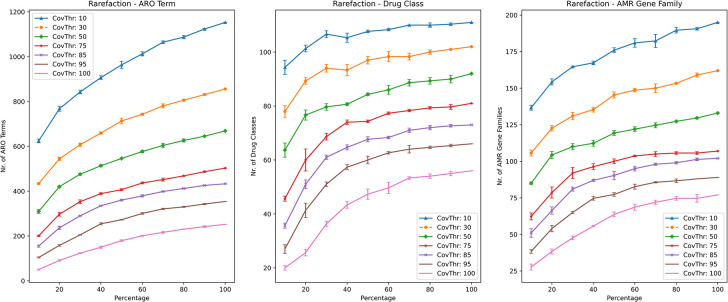
Fig 2. Rarefaction landscape using different gene coverage thresholds for number of antibiotic resistance ontology (ARO) terms, drug classes and AMR gene families for sample S1.
Each line graph contains lines representing the different gene cover thresholds used in the rarefaction analysis (indicated in the legend).

