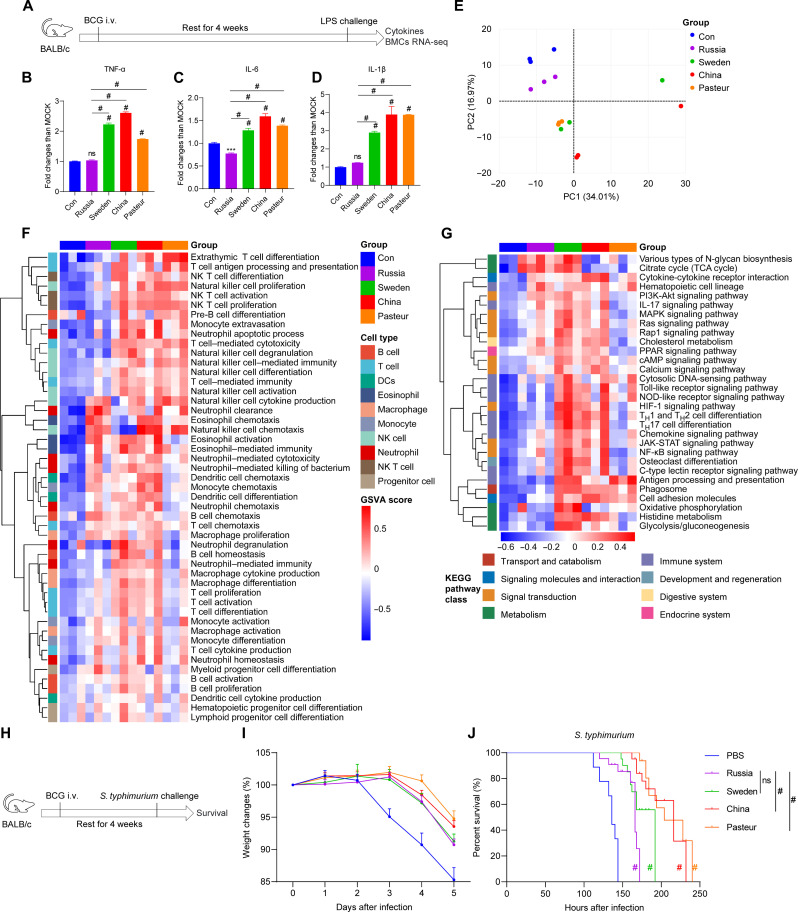
Fig. 2. Four BCG strains induced various levels of cytokines and nonspecific protection in vivo.
(A) Schema of the in vivo trained immunity experiments. (B to D) Cytokine levels in the serum of trained mice upon lipopolysaccharide (LPS) restimulation. MOCK, mean of the control group. Values are expressed as means ± SD. For (B) to (D), data are representative of three independent experiments with three biological duplicates. (E) Principal components analysis (PCA) of the global genes in BMCs. (F) gene set variation analysis (GSVA) of gene ontology biological process (GOBP) related to immune cell development and function. NK, natural killer. (G) GSVA of KEGG pathway related to immune cell metabolism and function. For (E) to (G), data represent means ± SD of three independent biological duplicates. TCA, tricarboxylic acid; MAPK, mitogen-activated protein kinase; PPAR, peroxisome proliferator–activated receptor; cAMP, cyclic adenosine 3′,5′-monophosphate; JAK-STAT, Janus kinase–signal transducer and activator of transcription. (H) Schema of S. typhimurium challenge infection. (I) Changes in the body weight of S. typhimurium–infected mice within 5 days. (J) Survival curves of infected mice, n = 9. PBS, control group. Survival curve was analyzed using log-rank (Mantel-Cox) test: ns, P > 0.05; #P < 0.0001.

