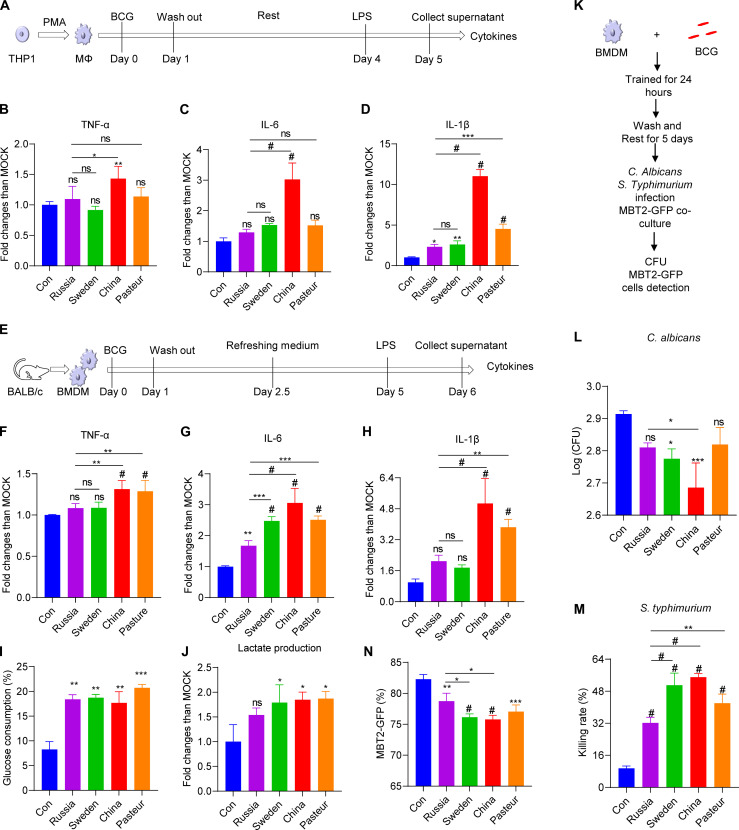
Fig. 3. Four BCG strains induced various degrees of cytokines and nonspecific protection in vitro.
(A) Schematic diagram of trained immunity in THP1–differentiated macrophages. (B to D) Cytokine profiles in control and trained THP1 macrophages upon LPS restimulation. (E) Schematic diagram of trained immunity in BMDMs. (F to H) Cytokine profiles in control and trained BMDMs upon LPS restimulation. (I) Glucose consumption of BCG-trained BMDMs upon LPS stimulation. (J) Lactate production of BCG-trained BMDMs upon LPS stimulation. (K) Schematic diagram of nonspecific protection against infection in BMDMs. (L) Total colony-forming units (CFU) of C. albicans quantified after 4 hours of infection. (M) Intracellular killing of S. typhimurium 2 hours after phagocytosis by trained BMDMs. (N) The proportion of MBT2-GFP cells cocultured with BCG-trained BMDMs. One-way ANOVA test was used to compare groups: *P < 0.05; **P < 0.01; ***P < 0.001; #P < 0.0001. Values are expressed as means ± SD. Data are representative of three independent experiments with three replicates.

