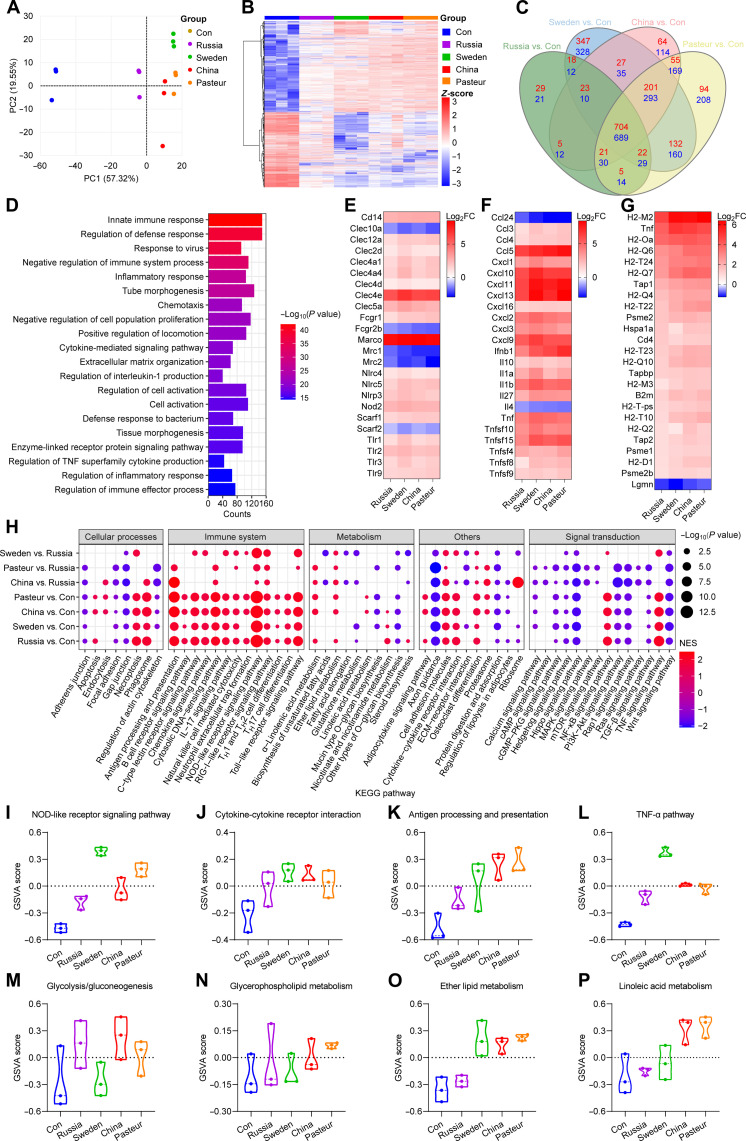
Fig. 4. Transcriptome characteristics of BMDMs after BCG training.
(A) PCA of the global gene changes. (B) Heatmap of pooled differentially expressed genes (DEGs) [adjusted P < 0.05, log2 fold change (log2FC) > 1] between BCG-trained groups and Con group. (C) Venn diagram of DEGs between Russia versus Con, Sweden versus Con, China versus Con, and Pasteur versus Con groups. (D) Top 20 GOBP pathway of 1393 shared DEGs in (C). (E) Heatmap of genes involved in phagocytosis and cell activation. (F) Heatmap of cytokines and chemokines genes. (G) Heatmap of genes involved in antigen processing and presentation. (H) Heatmap comparison of gene set enrichment analysis (GSEA) results (P < 0.05) among BCG-trained groups. NES, Normalized enrichment score; ECM, extracellular matrix; cGMP, cyclic guanosine 3′,5′-monophosphate. (I to L) Violin plots of the GSVA of factors involved in cell activation and inflammation. (M to P) Violin plots of the GSVA of pathways involved in cell metabolism. Data represent means ± SD of three independent biological duplicates.

