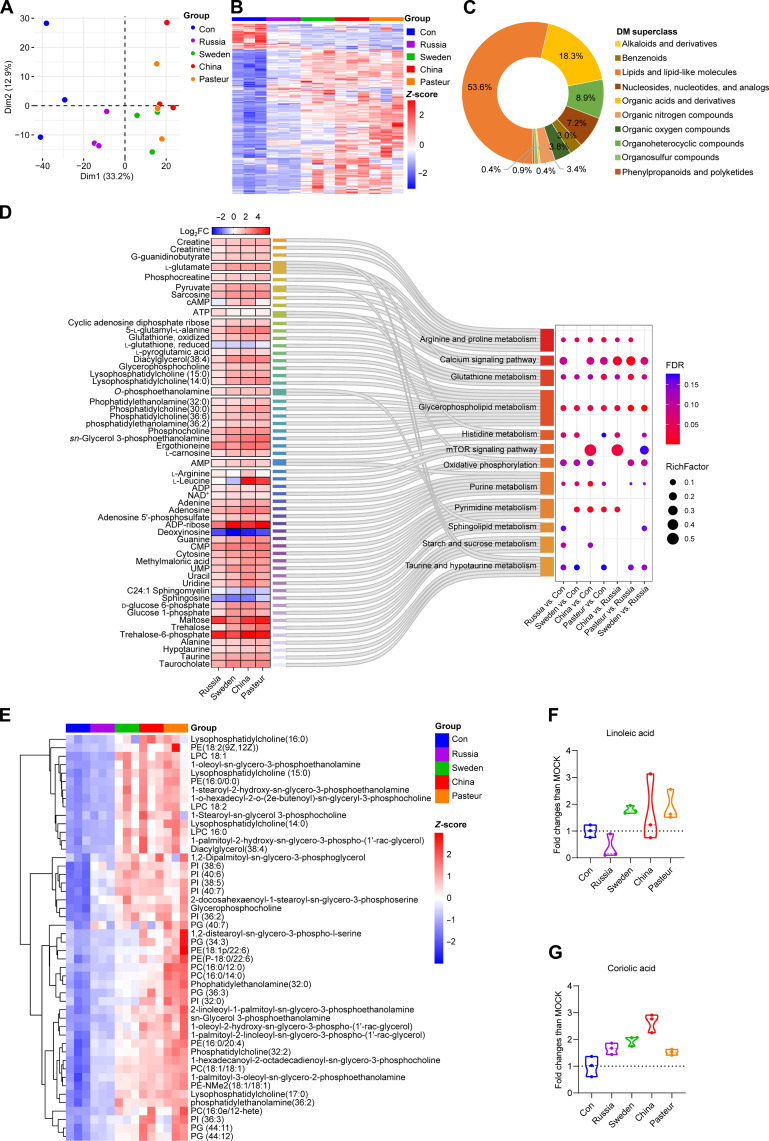
Fig. 6. Metabolic profiles of BMDMs after BCGs training.
(A) PCA plot of the qualitative metabolite changes. (B) Heatmap of pooled DMs (VIP > 1, P < 0.05) between BCG-trained groups and control group. (C) DM classification donut chart. (D) KEGG enrichment results of DMs (VIP > 1, P < 0.05). ATP, adenosine 5′-triphosphate; NAD+, nicotinamide adenine dinucleotide (oxidized form); UMP, uridine 5′-monophosphate. (E) Heatmap of differentially expressed glycerophospholipids (VIP > 1, P < 0.05, |log2FC| ≥ 1). (F) Relative abundance of linoleic acid identified by liquid chromatography–tandem mass spectrometry (LC-MS/MS). (G) Relative abundance of coriolic acid identified by LC-MS/MS. Data represent means ± SD of three independent biological duplicates.

