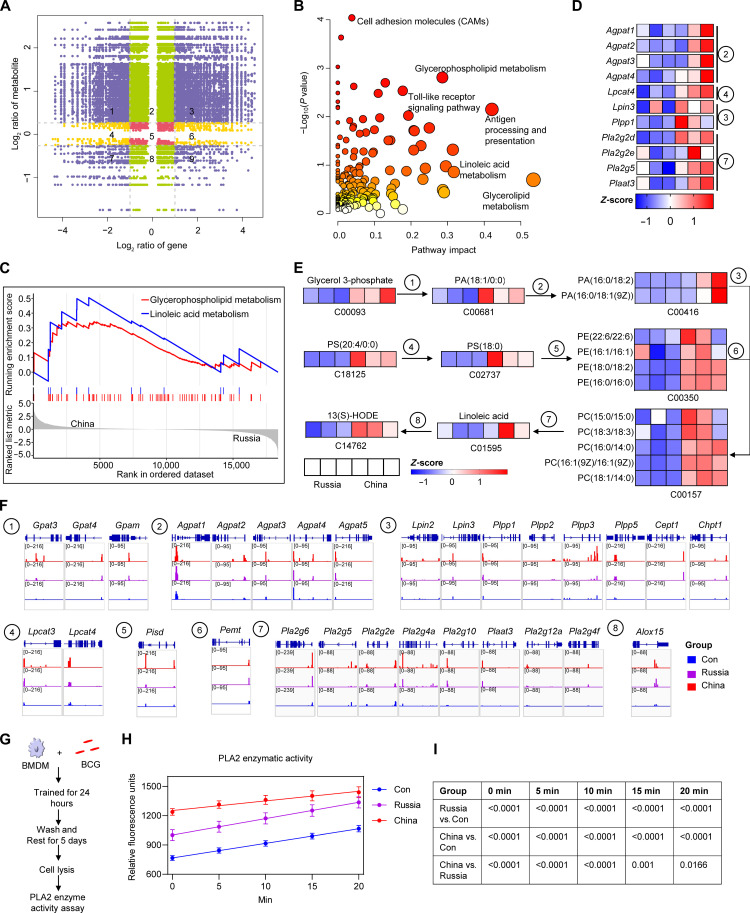
Fig. 7. Comparative multi-omics analysis of the high (China) and low (Russia) trained immunity groups.
(A) Nine quadrant charts of mRNA expression ratios and metabolite expression ratios between BCG-China and BCG-Russia groups. Purple dots, significant changes in both metabolite (DMs: VIP > 1, P < 0.05, |log2FC| > 0.26) and mRNA (DEGs: adjusted P value < 0.05, |log2FC| > 1); green dots, significant changes in metabolite only; yellow dots, significant changes in mRNA only. (B) Integrated analysis of metabolites and genes in part 3 of (A). (C) GSEA enrichment plot of glycerophospholipid and linoleic acid metabolic pathways of BCG-China versus BCG-Russia. (D) Heatmap of genes involved in glycerophospholipid and linoleic acid metabolism. (E) Glycerophospholipid and linoleic acid metabolic pathways with a heatmap of normalized data. Blue and red colors represent low and high concentrations, respectively, scaled by color intensity. (F) ATAC signals of genes involved in glycerophospholipid metabolism and linoleic acid metabolism. ① to ⑧: Genes involved in glycerophospholipid and linoleic acid metabolism. (G) Schematic diagram of PLA2 enzyme activity assay in BCG-trained BMDMs. (H) PLA2 enzymatic activity was shown as relative fluorescence units with time. Data represent means ± SD of five independent biological duplicates. (I) The table shows the P values (one-way ANOVA) for each time point in (H).

