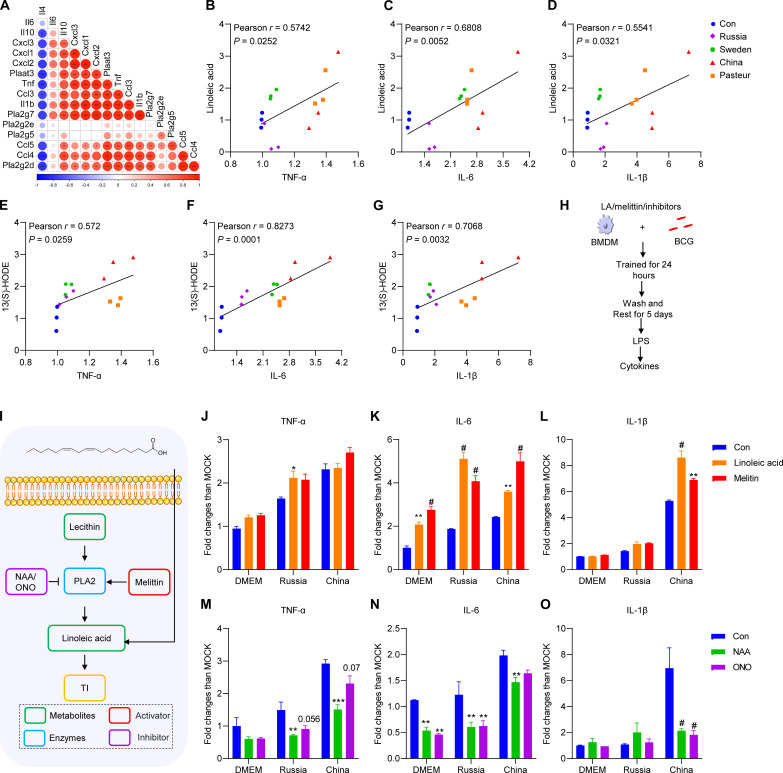
Fig. 8. Linoleic acid metabolism enhanced BCG-induced trained immunity.
(A) Correlation between cytokines genes and PLA2 genes. (B) Correlation between TNF-α fold change and linoleic acid fold change. (C) Correlation between IL-6 fold change and linoleic acid fold change. (D) Correlation between IL-1β fold change and linoleic acid fold change. (E) Correlation between TNF-α fold change and 13(S)-HODE fold change. (F) Correlation between IL-6 fold change and 13(S)-HODE fold change; (G) Correlation between IL-1β fold change and 13(S)-HODE fold change. Correlations were performed using Spearman correlation analysis. (H) Schematic diagram of trained immunity supplementation with linoleic acid (LA) and melittin. (I) Schematic diagram of glycerophospholipid–linoleic acid metabolism. (J to L) Cytokines of BCG-trained BMDMs supplementation with linoleic acid (10 μM) and melittin (0.25 μg/ml) upon LPS restimulation. (M to O) Cytokines of BCG-trained BMDMs supplementation with ONO-RS-082 (ONO; 50 μM) and 1-naphthylacetic acid (NAA; 50 μM) upon LPS restimulation. Data represent means ± SD of three independent biological duplicates. Data are representative of two independent experiments. Two-way ANOVA was used to compare groups; *P < 0.05; **P < 0.01; ***P < 0.001; #P < 0.0001.

