. 2024 Apr 5;12:RP86805. doi: 10.7554/eLife.86805

Figure 1. Activation patterns in deep cortical layers distinguished closed and open loop locomotion onsets more strongly than superficial layers.

(A) Schematic of GCaMP expression strategy. We either injected an AAV-PHP.eB virus retro-orbitally to express GCaMP brain wide (C57BL/6), in cortical excitatory neurons (Emx1-Cre) or in a subset of SST positive interneurons (see Methods and Supplementary file 2), or used the progeny of a cross of a cell type-specific Cre driver line (NeuronalCre: Cux2-CreERT2, Scnn1a-Cre, Tlx3-Cre, Ntsr1-Cre, PV-Cre, VIP-Cre, or SST-Cre) with the Ai148 GCaMP6 reporter line. All mice were then implanted with a crystal skull cranial window prior to imaging experiments. (B) Schematic of the experimental setup. We imaged GCaMP fluorescence under 470 nm LED illumination with an sCMOS camera through a macroscope. Mice were free to locomote on an air-supported spherical treadmill while coupled (closed loop), uncoupled (open loop), or no (dark) visual flow in the form of movement along a virtual corridor was displayed on a toroidal screen placed in front of the mouse. Walls of the virtual corridor were patterned with vertical sinusoidal gratings. In a separate condition, we then presented drifting grating stimuli (grating session, see Methods). (C) Average response in an example C57BL/6 mouse that expressed GCaMP6 brain wide during closed loop locomotion onsets (top row, 83 onsets) and open loop locomotion onsets (bottom row, 153 onsets). Locomotion onsets in both conditions activated dorsal cortex similarly. (D) As in C, but in an example Tlx3-Cre × Ai148 mouse that expressed GCaMP6 in layer 5 (L5) intratelencephalic (IT) neurons during closed loop locomotion onsets (top row, 88 onsets) and open loop locomotion onsets (bottom row, 83 onsets). Note that activity decreased in posterior regions of dorsal cortex during closed loop locomotion onsets. (E) Example crystal skull craniotomy marking the six regions of interest in each hemisphere we selected: primary visual cortex (V1, red), retrosplenial cortex (RSC, blue), antero-medial secondary visual cortex (V2am, green), primary motor cortex (M1, yellow), anterior cingulate cortex (A24b, purple), and secondary motor cortex (M2, cyan). The white cross marks bregma. (F) Average response during closed loop locomotion onsets in C57BL/6 mice that expressed GCaMP brain wide in the six regions of interest (activity was averaged across corresponding regions in both hemispheres). Mean (lines) and 90% confidence interval (shading) are calculated as a hierarchical bootstrap estimate for each time bin (see Methods and Supplementary file 1). (G) As in F, but for open loop locomotion onsets. (H) As in F, but for visual flow onsets in the open loop condition restricted to times when the mice were not locomoting. (I) Average response during closed loop locomotion onsets in Tlx3-Cre × Ai148 mice that expressed GCaMP6 in L5 IT neurons, activity was averaged across corresponding regions in both hemispheres. Mean (lines) and 90% confidence interval (shading) are calculated as a hierarchical bootstrap estimate for each time bin (see Methods and Supplementary file 1). (J) As in I, but for open loop locomotion onsets. (K) As in J, but for visual flow onsets during open loop sessions restricted to times when the mice were not locomoting. (L) Similarity of the average closed and open loop locomotion onset responses quantified as the correlation coefficient between the two in a window –5 s to +3 s around locomotion onset (see Methods). Error bars indicate SEM over the 12 (6 per hemisphere) cortical regions. Statistical comparisons are against the Tlx3 data and were corrected for family-wise error rate (see Methods and Supplementary file 1): adjusted significance thresholds, n.s.: not significant, *: p<0.05/9, **: p<0.01/9, ***: p<0.001/9.

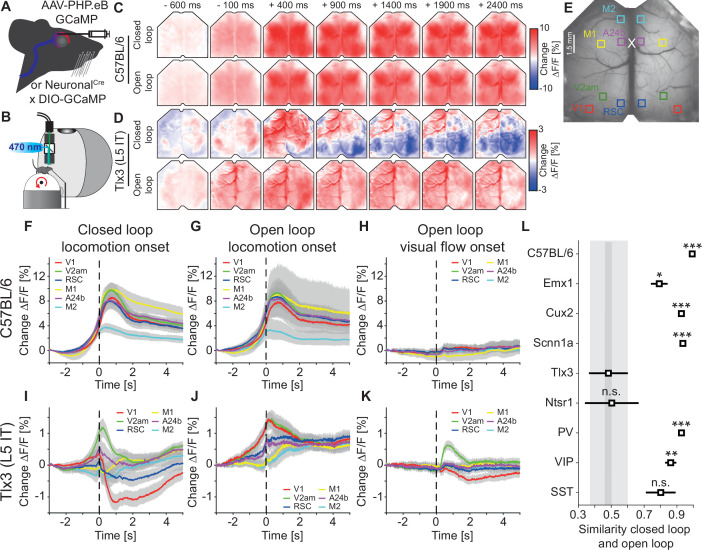
Figure 1.

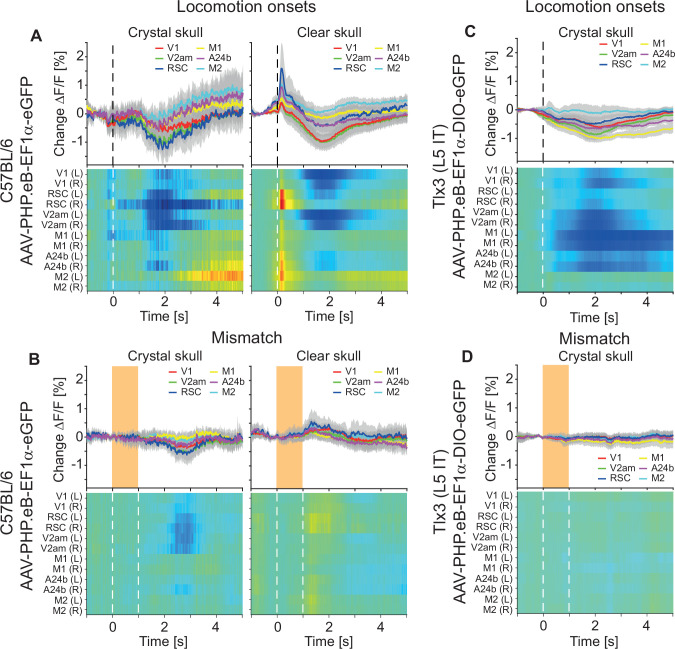
Figure 1—figure supplement 1. Fluorescence changes driven by hemodynamic occlusion.

Figure 1—figure supplement 1.

(A) Average responses during locomotion onsets in C57BL/6 mice that expressed eGFP brain wide using a crystal skull preparation or in similarly transfected mice using a clear skull preparation (see Methods). Top row shows the average activity of corresponding regions in dorsal cortex. Mean (lines) and 90% confidence interval (shading) are calculated as a hierarchical bootstrap estimate for each time bin (see Methods and Supplementary file 1). The heatmaps in the bottom row show the responses for individual regions of interest. Heatmaps are scaled to the y-axis limits of the plot above (blue low, red high). Note, the fast onset transient apparent in the clear skull preparation was absent in the crystal skull preparation, while the slow decrease of activity was present in both. The increase in fluorescence at locomotion onset, which was primarily apparent in the clear skull preparation, is driven by hemodynamic occlusion. (B) As in A, but for mismatches. Orange shading (top) or white dashed lines (bottom) indicate the duration of the mismatch stimulus. (C) As in A, left, but for Tlx3-Cre that had been retro-orbitally injected with an AAV-PHP.eB-DIO-eGFP to express eGFP in layer 5 (L5) intratelencephalic (IT) neurons. (D) As in B, left, but for Tlx3-Cre that had been retro-orbitally injected with an AAV-PHP.eB-DIO-eGFP to express eGFP in L5 IT neurons.
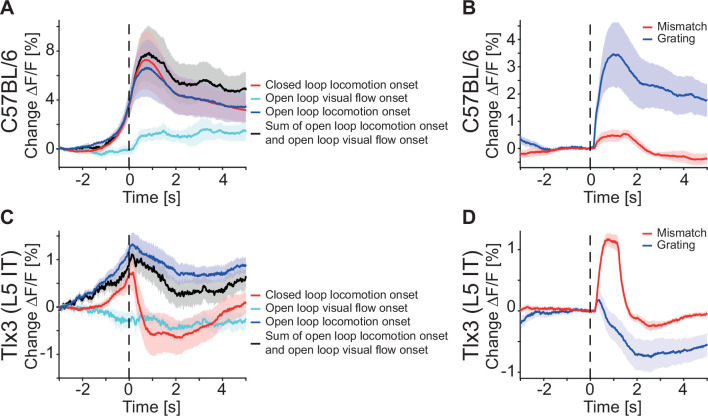
Figure 1—figure supplement 2. In primary visual cortex (V1), the sum of locomotion and visual flow onset could not explain the closed loop locomotion onset response of layer 5 (L5) intratelencephalic (IT) neurons.

Figure 1—figure supplement 2.

(A) Average responses during closed (red) and open loop (blue) locomotion onsets, as well as open loop visual flow (turquoise) onsets, and the sum of open loop locomotion and open loop visual flow onsets (black) in C57BL/6 mice that expressed GCaMP brain wide (6 mice). Closed loop locomotion onset responses in V1 were larger than open loop locomotion onset responses, and part of this difference could be explained by the visual flow onset responses. Shading indicates SEM over mice. (B) Average response during mismatch (red) and full-field drifting grating onsets (blue) in six C57BL/6 mice that expressed GCaMP brain wide. Same data as in Figure 3B and C. Shading indicates SEM over mice. (C) As in A, but for Tlx3-Cre × Ai148 mice that expressed GCaMP6 in L5 IT neurons (15 mice). Closed loop locomotion onset responses in V1 could not be explained as the sum of open loop locomotion and visual flow onset responses. (D) As in B, but for Tlx3-Cre × Ai148 mice that expressed GCaMP6 in L5 IT neurons (15 mice). Same data as in Figure 3E and F.
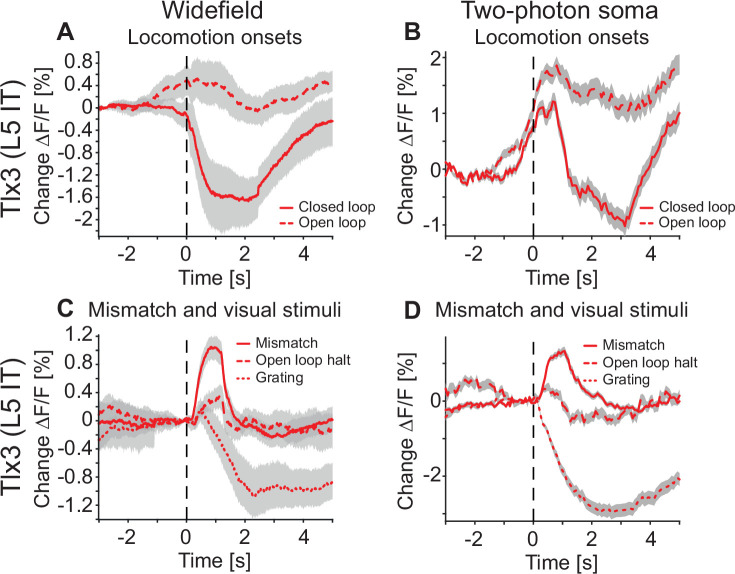
Figure 1—figure supplement 3. Layer 5 (L5) intratelencephalic (IT) soma recorded in primary visual cortex (V1) with two-photon imaging show similar patterns of activity as the widefield signal recorded at the surface of the dorsal cortex.

Figure 1—figure supplement 3.

(A) Average response of V1 recorded with the widefield macroscope during closed (solid) or open loop (dashed) locomotion onsets in Tlx3-Cre × Ai148 mice that expressed GCaMP6 in L5 IT neurons. Mean (lines) and 90% confidence interval (shading) are calculated as a hierarchical bootstrap estimate for each time bin (see Methods and Supplementary file 1). (B) Average response of L5 soma in V1, recorded with two-photon imaging in the same Tlx3-Cre × Ai148 mice that expressed GCaMP6 in L5 IT neurons as in A, during either closed loop (solid) or open loop (dashed) locomotion onsets. Shading indicates SEM over 8434 neurons. (C) As in A, but for responses to mismatches (solid), open loop halts (dashed) or drifting grating onsets (dotted). Mean (lines) and 90% confidence interval (shading) are calculated as a hierarchical bootstrap estimate for each time bin (see Methods and Supplementary file 1). (D) As in B, but for responses to mismatches (solid), open loop halts (dashed) or drifting grating onsets (dotted). Shading indicates SEM over 8434 neurons.
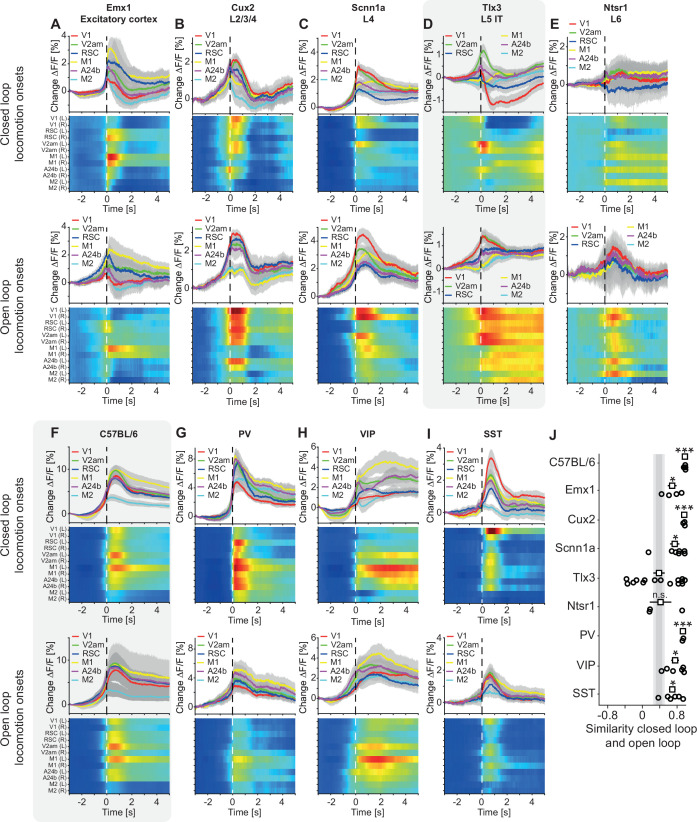
Figure 1—figure supplement 4. Layer 5 (L5) intratelencephalic (IT) neurons had strikingly different responses during closed and open loop locomotion onsets compared to other cortical neuron types.

Figure 1—figure supplement 4.

(A) Average response during closed loop locomotion onsets (top) and open loop locomotion onsets (bottom) in Emx1-Cre mice that expressed GCaMP6 in excitatory cortical neurons. Mean (lines) and 90% confidence interval (shading) are calculated as a hierarchical bootstrap estimate for each time bin (see Methods and Supplementary file 1). Heatmaps are scaled to the y-axis limits of the plot above (blue low, red high). (B) As in A, but for Cux2-CreERT2 × Ai148 mice that expressed GCaMP6 in upper layer excitatory neurons. (C) As in A, but for Scnn1a-Cre × Ai148 mice that expressed GCaMP6 in L4 excitatory. (D) As in A, but for Tlx3-Cre × Ai148 mice that expressed GCaMP6 specifically in L5 IT neurons. Data are the same as in Figure 1I and K. (E) As in A, but for Ntsr1-Cre × Ai148 mice that expressed GCaMP6 in excitatory L6 neurons. (F) As in A, but for C57BL/6 mice that expressed GCaMP brain wide. Data are the same as in Figure 1F and G. (G) As in A, but for PV-Cre × Ai148 mice that expressed GCaMP6 in PV neurons. (H) As in A, but for VIP-Cre × Ai148 mice that expressed GCaMP6 in VIP neurons. (I) As in A, but for SST-Cre mice that expressed GCaMP6 in SST neurons. (J) Similarity of the average closed and open loop locomotion onset responses in V1 quantified as the correlation coefficient between the two in a window –5 s to +3 s around locomotion onset (left and right V1 were averaged, see Methods). Error bars indicate SEM over mice that had an average locomotion onset response of at least 1% ΔF/F in either the closed or the open loop condition (open circles: individual data points; 6 C57BL/6 mice, 4 Emx1-Cre mice, 7 Scnn1a-Cre mice, 14 Tlx3-Cre mice, 3 Ntsr1-Cre mice, 2 PV-Cre mice, 6 VIP-Cre mice, 6 SST-Cre mice, 3 Cux2-CreERT2 mice). Statistical comparisons are against the Tlx3 data and were corrected for family-wise error rate (see Methods and Supplementary file 1): adjusted significance thresholds, n.s.: not significant, *: p<0.05/9, **: p<0.01/9, ***: p<0.001/9.