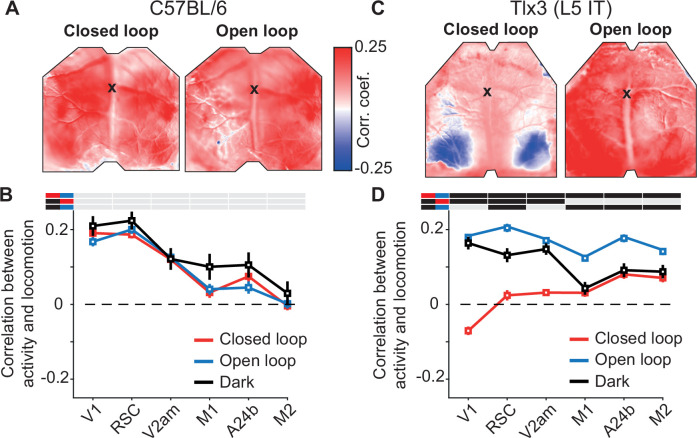
Figure 2. Layer 5 (L5) intratelencephalic (IT) neurons were differentially activated by locomotion depending on the type of visual feedback.
(A) Correlation between calcium activity and locomotion speed in the closed loop (left) and open loop (right) conditions, calculated for each pixel in the image for one example C57BL/6 mouse that expressed GCaMP brain wide. The black cross marks bregma. Activity in most of dorsal cortex correlates positively with locomotion speed in both closed and open loop conditions. (B) Average correlation between calcium activity and locomotion speed in the six regions of interest in closed loop (red), open loop (blue), or dark (black) conditions in six C57BL/6 mice that expressed GCaMP brain wide (308, 316, and 68 five-min recording sessions, respectively). Error bars indicate SEM over recording sessions. Bars above the plot indicate significant differences between conditions (compared conditions are indicated by colored line segments to the left, black: p<0.05, gray: n.s., see Supplementary file 1 for all information on statistical testing). On average, the correlation was highest in posterior dorsal cortex and was not different between conditions. (C) As in A, but for an example Tlx3-Cre × Ai148 mouse that expressed GCaMP6 in L5 IT neurons. Correlations of calcium activity and locomotion speed were lower in the closed loop condition compared to the open loop condition, most prominently in posterior regions of dorsal cortex. (D) As in B, but for 15 Tlx3-Cre × Ai148 mice that expressed GCaMP6 in L5 IT neurons (data from 420 closed loop, 394 open loop, and 194 dark 5 min recording sessions). Error bars indicate SEM over recording sessions. Correlation differed significantly between the closed and the open loop condition and was lowest in posterior dorsal cortex during the closed loop condition.

