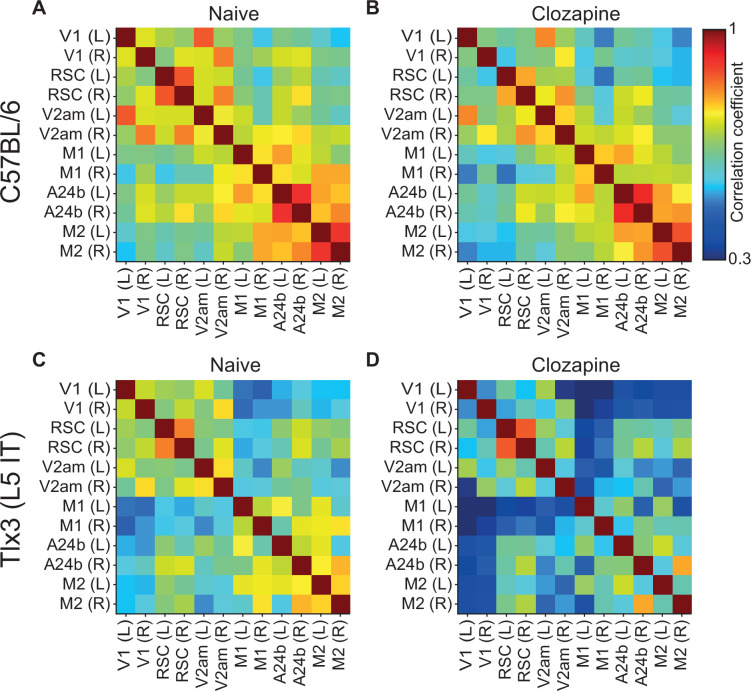
(
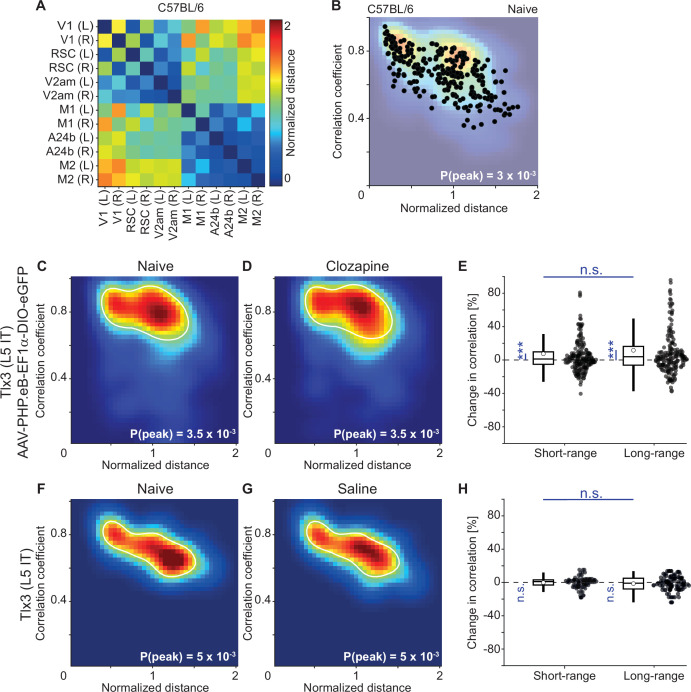
A) For each pair of dorsal cortex regions, we calculated the distance between the regions in a top-down view of dorsal cortex, normalized by the distance between bregma and lambda for each mouse (data are from an example C57BL/6 mouse that expressed GCaMP6 brain wide). (
B) For each pair, we then plotted the activity correlation against this distance as calculated in A (black dots). We then interpolated this distribution using a 40-by-40 2D grid to obtain the density plots (faded background), shown for all mice and pairs of regions in
Figures 6 and
7, and
Figure 5—figure supplement 1,
Figure 6—figure supplements 1 and
2. (
C) Density map of correlation coefficients as a function of distance between the regions, normalized across mice by the bregma-lambda distance (see panel B and Methods), for 6
Tlx3-Cre mice that had been retro-orbitally injected with an AAV-PHP.eB-DIO-eGFP to express eGFP in layer 5 (L5) intratelencephalic (IT) neurons. Peak density is indicated at the bottom right of the plot and corresponds to the maximum value of the color scale (dark red). The white line is a contour line drawn at 50% of peak value. (
D) As in C, but for the same six
Tlx3-Cre mice that expressed eGFP in L5 IT neurons after a single injection of the antipsychotic drug clozapine. The white line is the contour from panel C for comparison. (
E) Clozapine-induced change in the fluorescence correlation between regions, normalized to the correlation coefficient in the naive state, in six
Tlx3-Cre mice that expressed eGFP in L5 IT neurons. Data were split into short- and long-range activity correlations (see Methods). Boxes represent the median and the interquartile range. The open circle indicates the mean of the distribution. The whiskers mark 1.5 times the interquartile range. Dots are the individual data points (short-range: 204 pairs of regions, long-range: 192 pairs of regions). ***: p<0.001, n.s.: not significant. See
Supplementary file 1 for all information on statistical testing. (
F) As in C, but for three
Tlx3-Cre × Ai148 mice that expressed GCaMP6 in L5 IT neurons. (
G) As in F, but after a single injection of saline. The white line is the contour line from panel F for comparison. (
H) Saline-induced change in the activity correlation between regions, normalized to the correlation coefficient in the naive state, in three
Tlx3-Cre × Ai148 mice. Data were split into short- and long-range activity correlations (see Methods). Boxes represent the median and the interquartile range. The open circle indicates the mean of the distribution. The whiskers mark 1.5 times the interquartile range. Dots are the individual data points (short-range: 93 pairs of regions, long-range: 105 pairs of regions). n.s.: not significant. See
Supplementary file 1 for all information on statistical testing.


