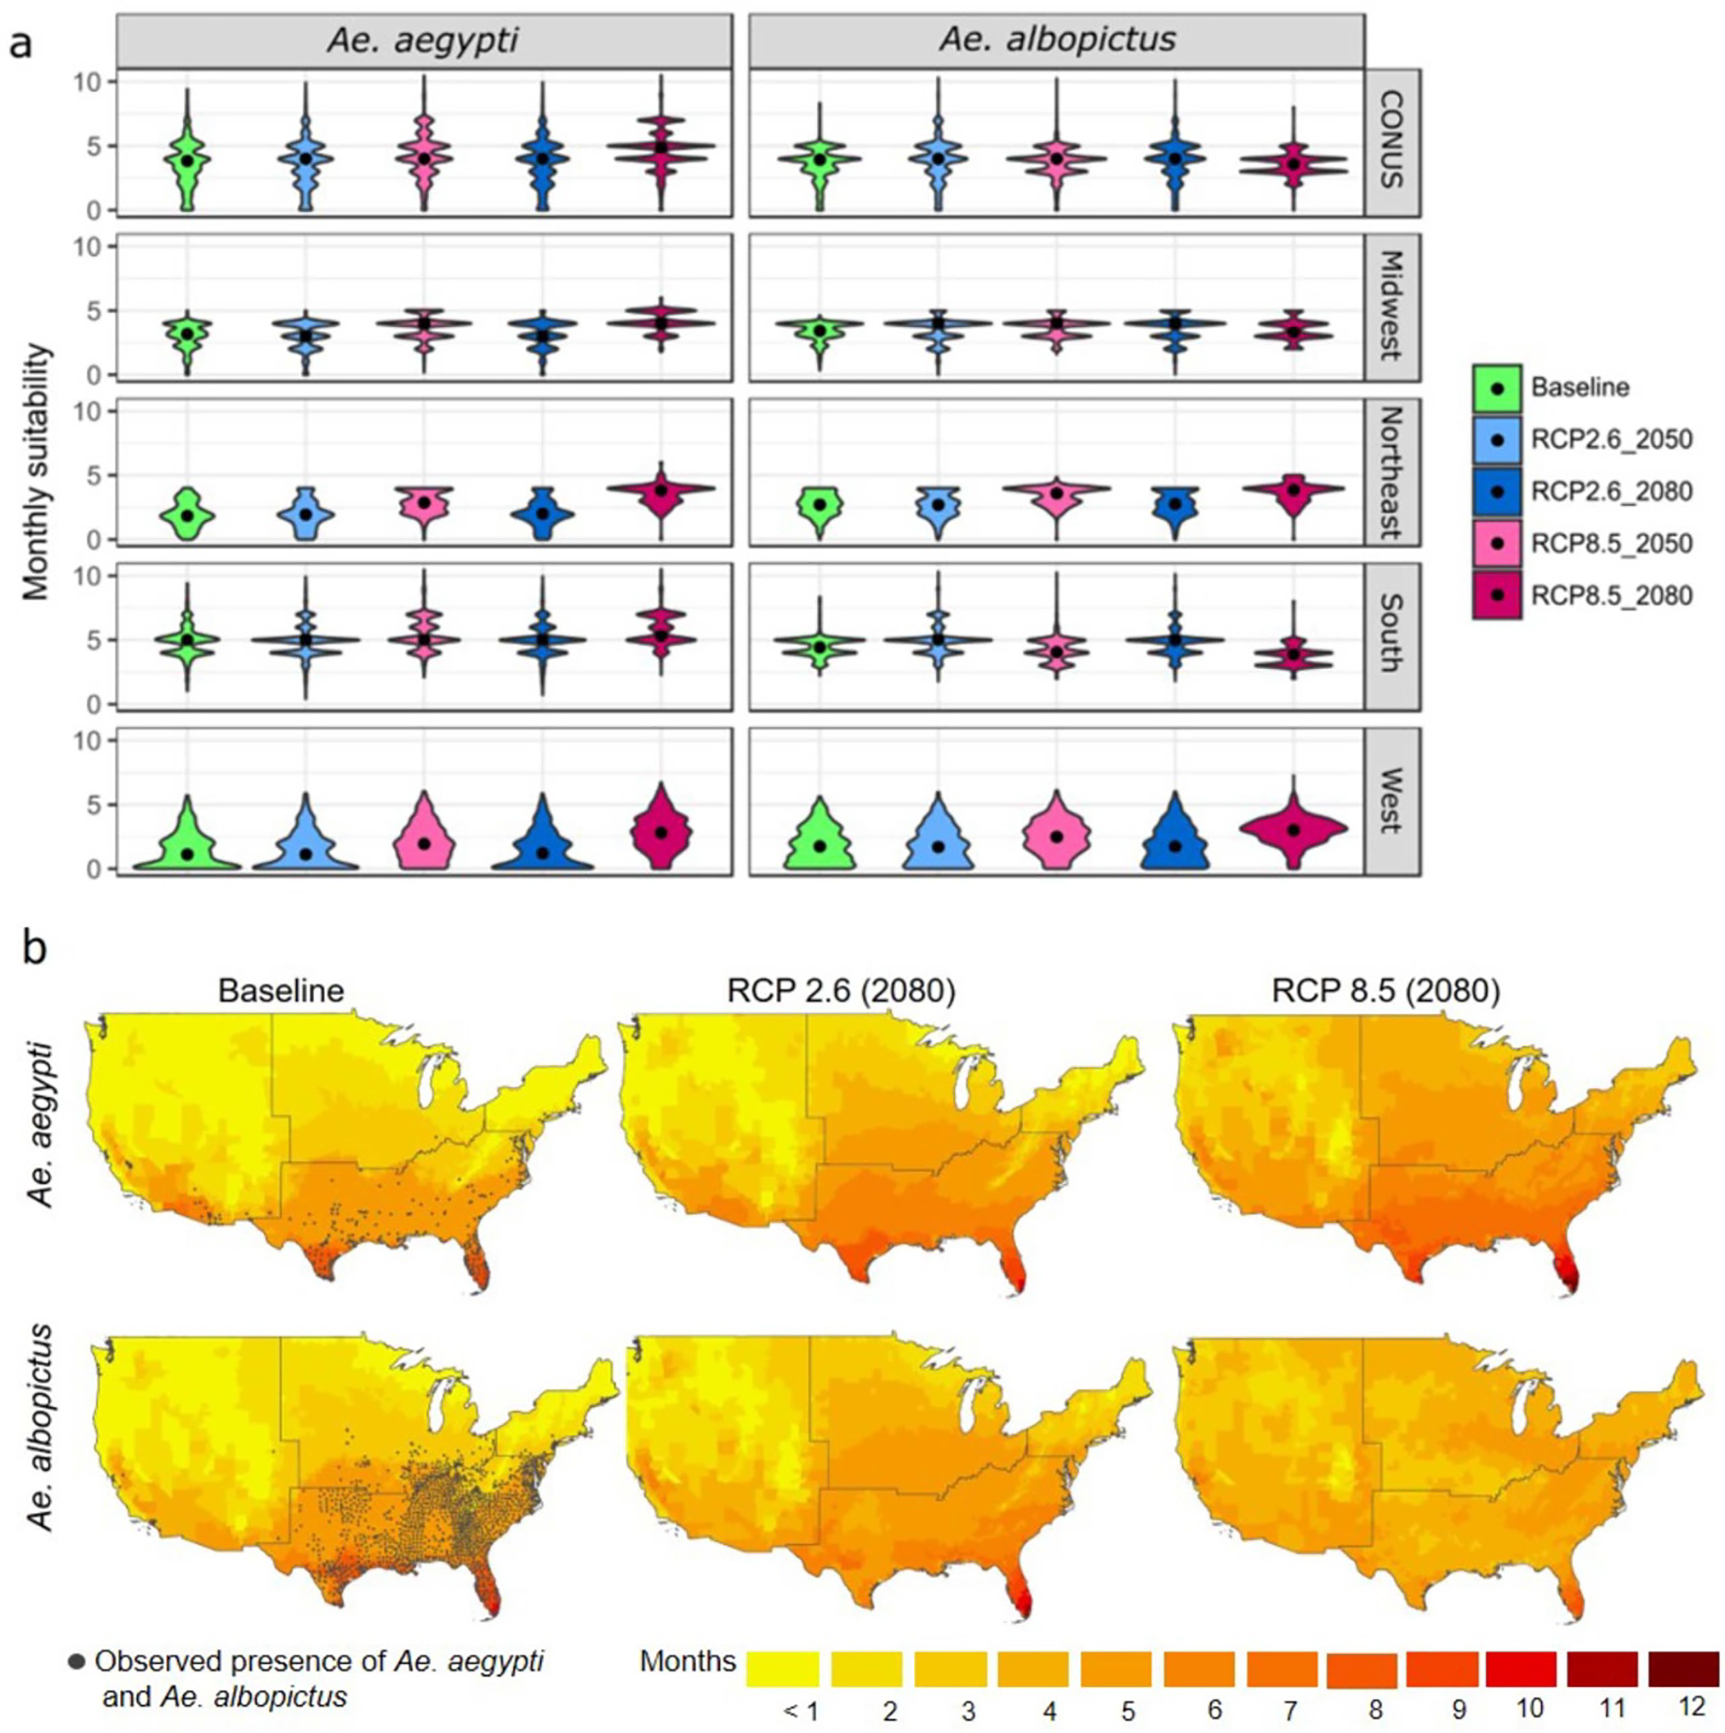
Figure 3.

Multi-model averaged cumulative monthly VTR by Ae. aegypti and Ae. albopictus, projected under RCP2.6 and RCP8.5, represented as (a) the national and regional distribution of county-level results for baseline, 2050, and 2080; and as (b) county-level maps for baseline and 2080. Observed Ae. aegypti and Ae. albopictus presence locations are from. The VTR data are reproduced from Ryan et al (2019); CC BY 4.0. Observed Ae. aegypti and Ae. albopictus presence locations are from Kraemer et al (2015); CC0 BY 1.0.
