Figure 4.

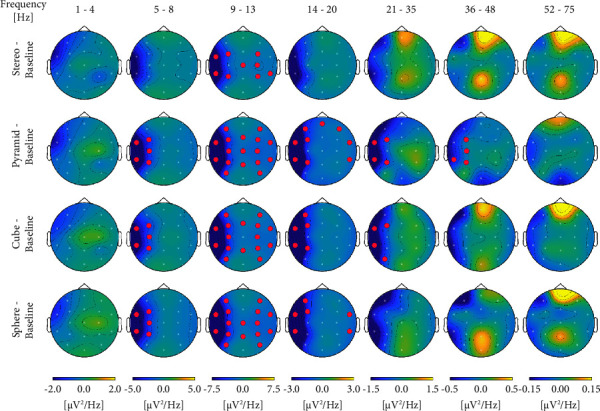
Significant results of topological analysis. Red spots represent areas of significant change in activity in the theta, alpha, beta1, beta 2, and gamma bands during exposure to different sound stimuli compared to baseline (N = 30).

Significant results of topological analysis. Red spots represent areas of significant change in activity in the theta, alpha, beta1, beta 2, and gamma bands during exposure to different sound stimuli compared to baseline (N = 30).