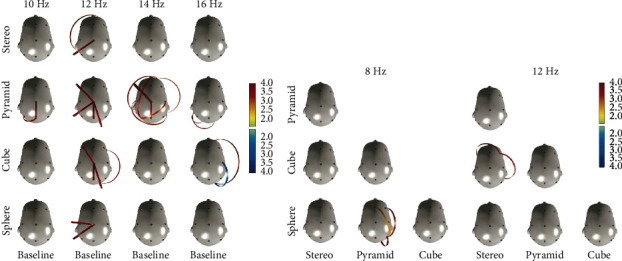
Figure 5.

Significant results of connectivity patterns in the range of 10 Hz to 16 Hz area. (a) Significant results of different connectivity patterns are mostly present at 12 Hz between baseline, GS shapes (pyramid, cube, sphere) and stereo (control). Red lines indicate significantly enhanced connectivity in exposure to sound stimuli; blue lines indicate significantly enhanced connectivity in baseline. Different connectivity patterns are observed mostly with pyramid GS in the range between 10 Hz and 16 Hz (N = 30). (b) Comparison of connectivity patterns between all sound stimuli. GS shapes sphere-pyramid at 8 Hz and cube-stereo at 12 Hz (N = 30).
