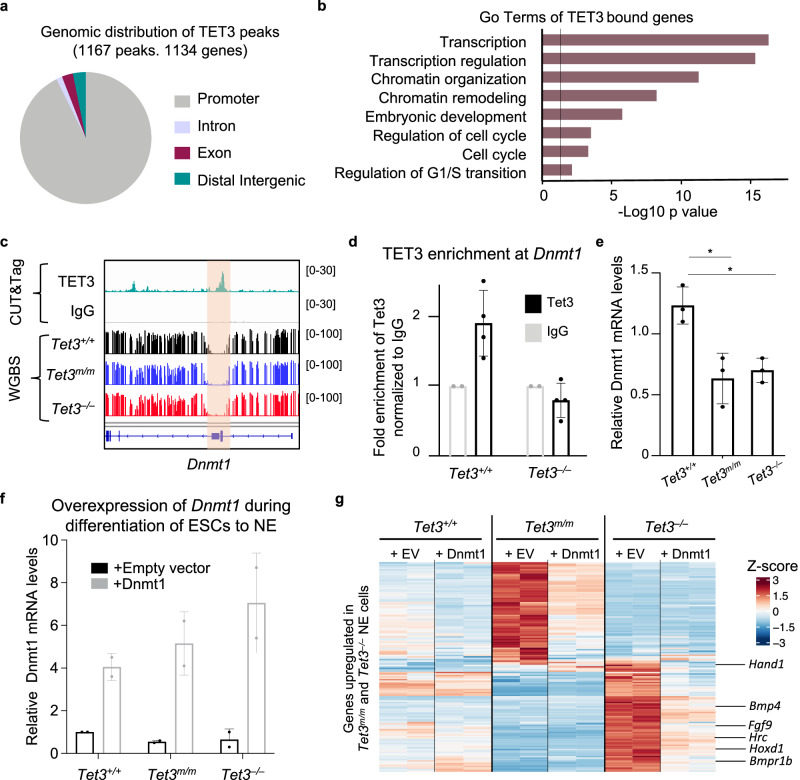
Fig. 5. Genome wide occupancy of TET3 in NE cells by CUT&Tag and its enrichment at Dnmt1 locus.
a Genomic distribution of 1167 peaks identified by CUT&Tag in Tet3+/+ NE cells. Note, vast majority of the peaks are at promoters. b GO analysis of TET3-bound genes. c IGV tracks showing TET3 CUT&Tag peaks and DNA methylation levels at Dnmt1 promoter region. d TET3 enrichment at the Dnmt1 promoter quantified by ChIPqPCR. Data normalized to IgG. e Quantification of Dnmt1 mRNA levels in NE cells (day 3 of –LIF + RA) by RT-qPCR. f Quantification of Dnmt1 by RT-qPCR in NE cells expressing either empty vector (EV) or Dnmt1. g Heatmap of upregulated genes in Tet3m/m and Tet3–/– NE cells where their expression is corrected by overexpression of Dnmt1. For all panels error bars represent SD and * p < 0.05 **p < 0.005.

