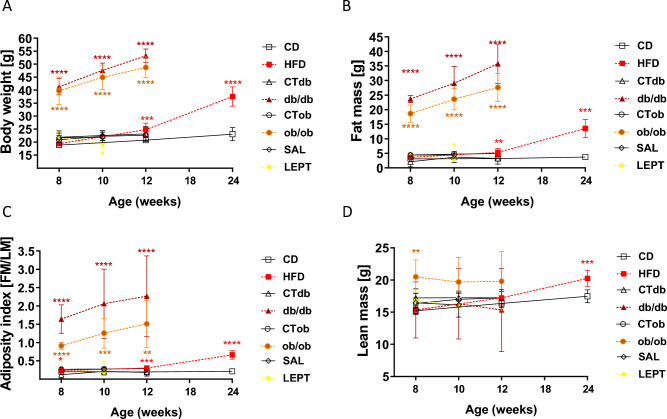
Figure 1.
Phenotype characterisation of mouse models for obesity and pharmacological hyperleptinemia. Changes in (A) body weight, (B) fat mass, (C) adiposity index, and (D) lean mass measured by Time-Domain Nuclear Magnetic Resonance (TD-NMR spectroscopy; Bruker Minispec LF90 II) in the following models: (i) diet-induced obesity (DIO) protocol with mice fed chow diet (CD) or high fat diet (HFD) for 16 weeks; (ii) db model: mice lacking long isoform of leptin receptor (ObRb; db/db); (iii) obmodel: mice lacking leptin (ob/ob); (iv) pharmacological hyperleptinemia model (LEPT) with mice injected either with saline (SAL) or 100 μg of leptin (LEPT) for 16 days. Lean littermates of the mutants served as controls (CT). Measurement was performed at 8, 12, 24 wk of age for DIO; 8, 10, 12 wk of age for db/db and ob/ob models: 8, 10 wk of age for LEPT. Different symbols represent various models: DIO (square), db/db (triangle), ob/ob (circle), LEPT (diamond). Colored lines correspond to experimental groups: HFD treatment (red), db/db model (brown), ob/ob model (orange), LEPT (yellow). Black lines correspond to control groups. Statistical differences were tested using Mann–Whitney test. Asterisks indicate significant differences *p < 0.05; **p < 0.01; ***p < 0.001; ****p < 0.0001.

