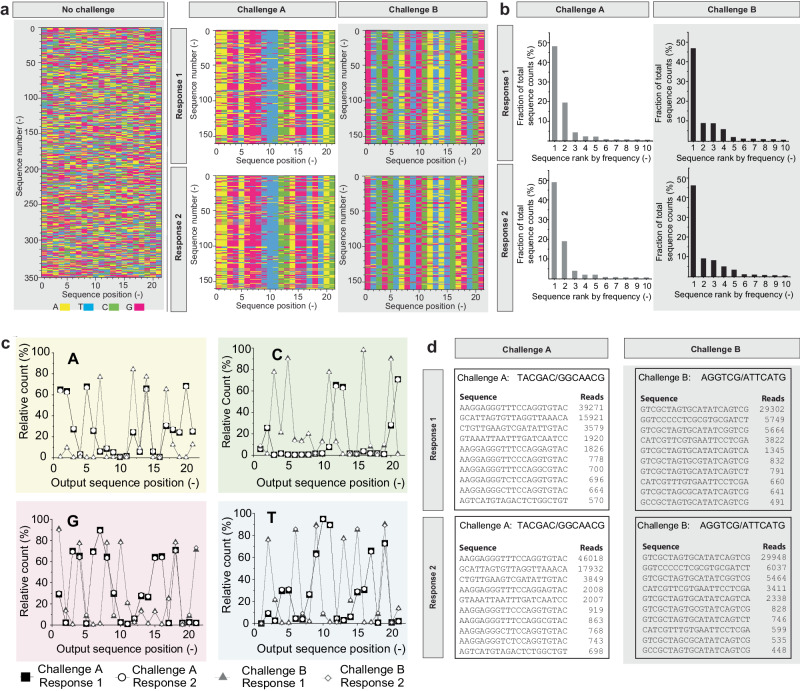
Fig. 2. Multi-level challenge-response-pair analysis.
a Positional base content (A, C, G, T) of arbitrary subsets of sequence reads generated as a response from separate challenges with experimental duplicates (response 1 and response 2). As a comparison, the equivalent result generated by non-selectively reading random DNA is shown, as found in Meiser et al.11. The x-axis represents the 21-mer composition of the orDNA’s output segment, the y-axis the (arbitrary) sequence number within the analyzed set. b Relative counts of the 10 most frequent output sequences, for the same challenge response pairs (CRPs) as in (a). c Relative frequency of A, C, G and T across the 21 positions of the output across the entire read set resulting from Illumina sequencing of the same CRPs as in (a). d Examples of datasets as used for further numeric processing, showing the ten most frequent sequences with their absolute read count resulting from the same CRPs as in (a). Source data are provided as a Source Data file.

