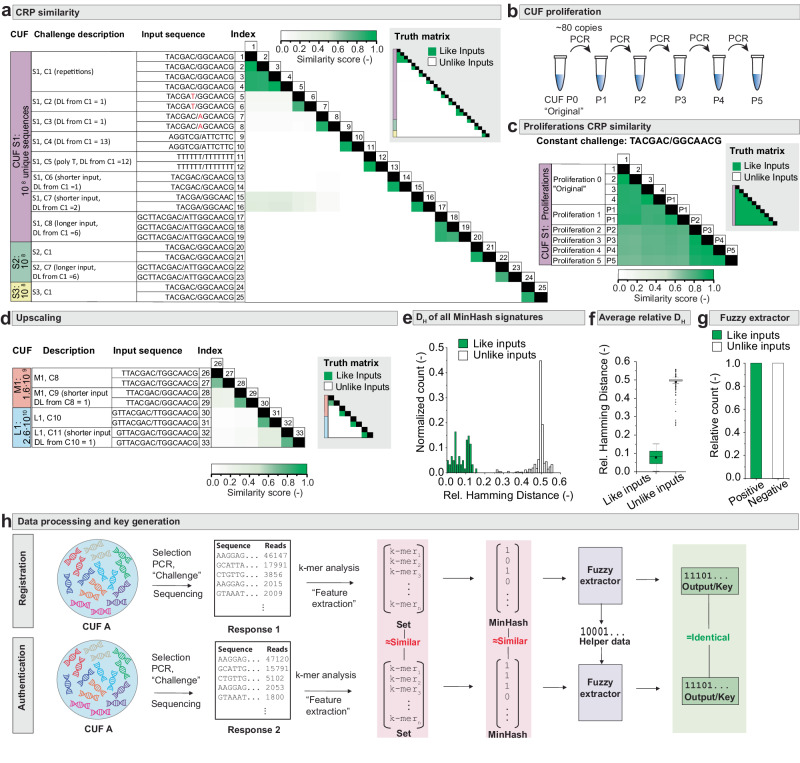
Fig. 3. CUF evaluation and key generation.
a Correlation matrix comparing experimentally measured similarity scores (in green color gradient) as calculated from k-mer sets extracted from the sequencing reads for all experiments performed on chemical unclonable functions (CUFs) S1, S2 and S3, comprising 108 unique sequences each (Supplementary Note 3). Indices correspond to the experiment number. Notable relationships between the different challenges are described next to the input sequences, including Levenshtein distances DL. The truth matrix indicates which correlated indices stem from like and unlike inputs. b CUF proliferation method to produce daughter generations (P1–P5) of the same CUF by PCR. c Correlation matrix and truth table in analogy to (a), comparing five proliferations of CUF S1 in their respective response to the same challenge. d Correlation matrix and truth matrix in analogy to (a), comparing the larger CUFs M1 and L1 in the edge case of a minimal Levenshtein distance (DL) between the challenges. e Histogram of relative Hamming distances between MinHashes of cross-comparisons between the 39 measured challenge response pairs (CRPs) as shown in (a)–(d). n = 680 comparisons between unlike inputs, n = 61 comparisons between like inputs. f Boxplot showing average relative Hamming distances, as per the distributions in (e). n = 680 comparisons between unlike inputs, n = 61 comparisons between like inputs. Indicated are the median (middle line), mean (circled dot), 25th and 75th percentile (box) and 1.5 interquartile range (whiskers), with outliers marked as black dots. g Assignment of compared responses to belonging to same (positive) or different (negative) challenges by the fuzzy extractor. n = 680 comparisons between unlike inputs, n = 61 comparisons between like inputs. h Schematic of CRP generation and data processing to generate and compare numerical keys from noisy sequencing data, involving k-mer analysis, MinHash generation and fuzzy extraction. Source data are provided as a Source Data file.

