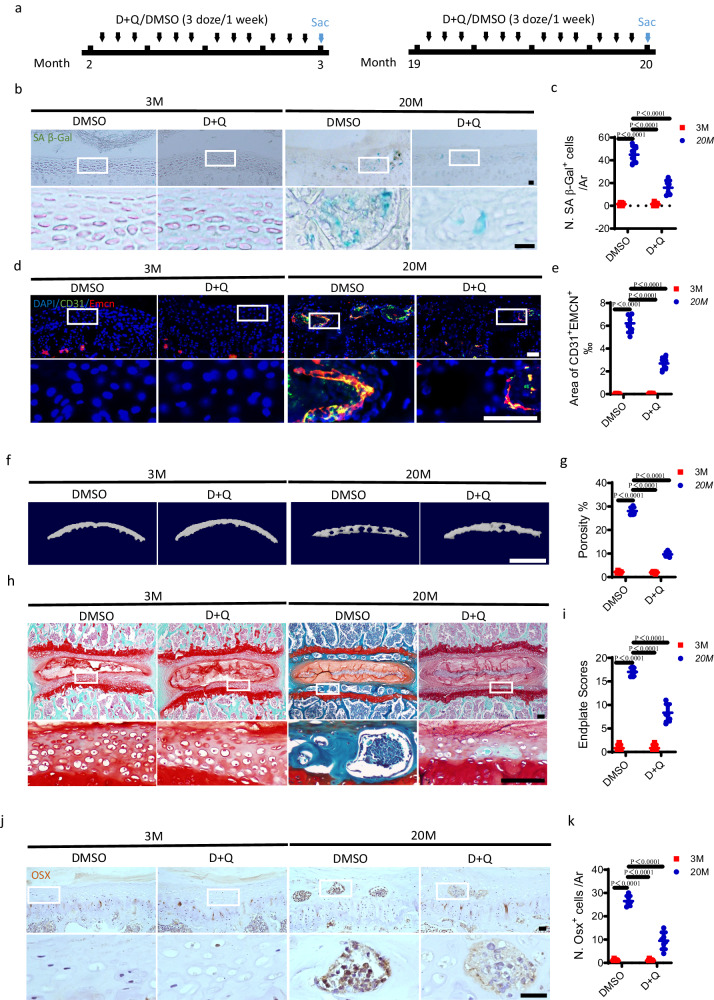
Fig. 4. The sclerosis of endplates is delayed by clearance of senescent cells in aged mice.
a–k Treatment regimen with D + Q or DMSO (black arrows) in 3-month-old or 20-month-old mice. Blue arrow indicates the day of euthanasia. b Representative images of coronal mouse caudal endplate sections of L4/5 stained for SA-βGal (green). Scale bars, 50 μm. c Quantitative analysis of the number of SA-βGal+ cells in the endplates of b. d Representative immunofluorescent images of CD31 (green), Emcn (red) staining and DAPI (blue) staining of nuclei in the endplates. Scale bars, 50 μm. e Permillage of CD31+Emcn+ area in endplates of d. f Representative three-dimensional µCT images of the mouse caudal endplates of L4/5 (coronal view). Scale bars, 500 μm. g Quantitative analysis of the total porosity of f. h Representative images of safranin O and fast green staining in the endplates, proteoglycan (red) and cavities (green). Scale bars, 50 μm. i Endplate scores as an indication of endplate degeneration based on safranin O and fast green staining. j Representative immunohistochemical images of Osterix (Osx) in the endplates. Scale bars, 50 μm. k Quantitative analysis of the number of Osx+ cells in the endplates of j. n = 6 per group. Data are represented as means ± standard deviations, as determined by One-way ANOVA. Source data are provided as a Source Data file.

