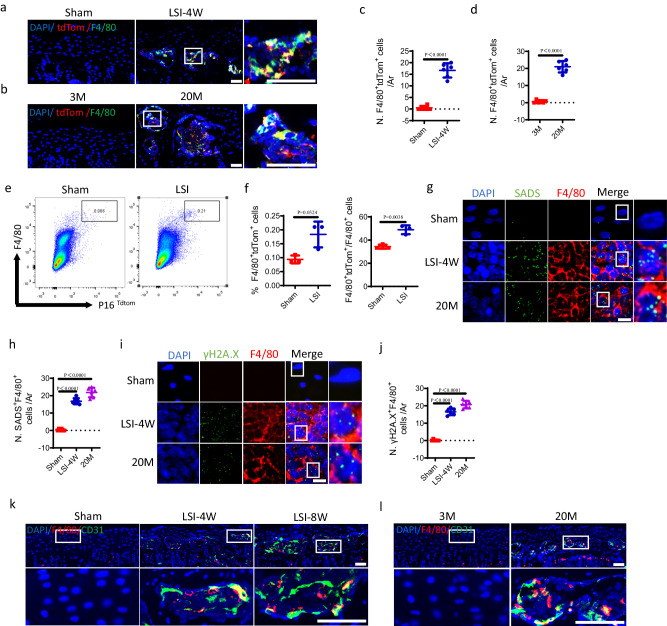
Fig. 5. Abundant macrophages undergo senescence in the endplates of LSI mice and aged mice.
Representative immunofluorescent images of tdTom+ (red), F4/80+ (green) cells and DAPI (blue) staining of nuclei in LSI surgery model (a) or aging model (b) of cdkn2a (p16)tdTom mice. Scale bars, 50 μm. c, d Quantitative analysis of the number of F4/80+tdTom+ cells in the endplates of a and b. n = 6 per group. e Representative images of flow cytometry analysis. cdkn2a (p16)tdTom mice underwent sham or LSI surgery. Cells were isolated from the endplates. f Quantitative analysis of e. n = 3 per group. g Representative images of senescence-associated distension of satellites (SADS, green), F4/80 (red) and DAPI (blue) staining of nuclei in the endplates of LSI surgery mice or aged mice by performing simultaneous immunofluorescent staining and immune-fluorescent in situ hybridization (FISH). Scale bars, 10 μm. h Quantitative analysis of the number of F4/80+SADS+ cells (≥4 SADS/cell) in endplates of g. n = 6 per group. i Representative immunofluorescent images of γH2A.X (green), F4/80 (red) and DAPI (blue) staining of nuclei in the endplates of LSI surgery mice or aged mice. Scale bars, 10 μm. j Quantitative analysis of the number of F4/80+γH2A.X+ cells in the endplates of i. n = 6 per group. Representative immunofluorescent images of F4/80 (red), CD31 (green) and DAPI (blue) staining of nuclei in the endplates at 4, and 8 weeks after LSI or sham surgery (k) or in 3-month-old or 20-month-old mice (l). Scale bars, 50 μm. n = 3–6 per group. Data are represented as means ± standard deviations, as determined by two-tailed Student’s t test or One-way ANOVA. Source data are provided as a Source Data file.

