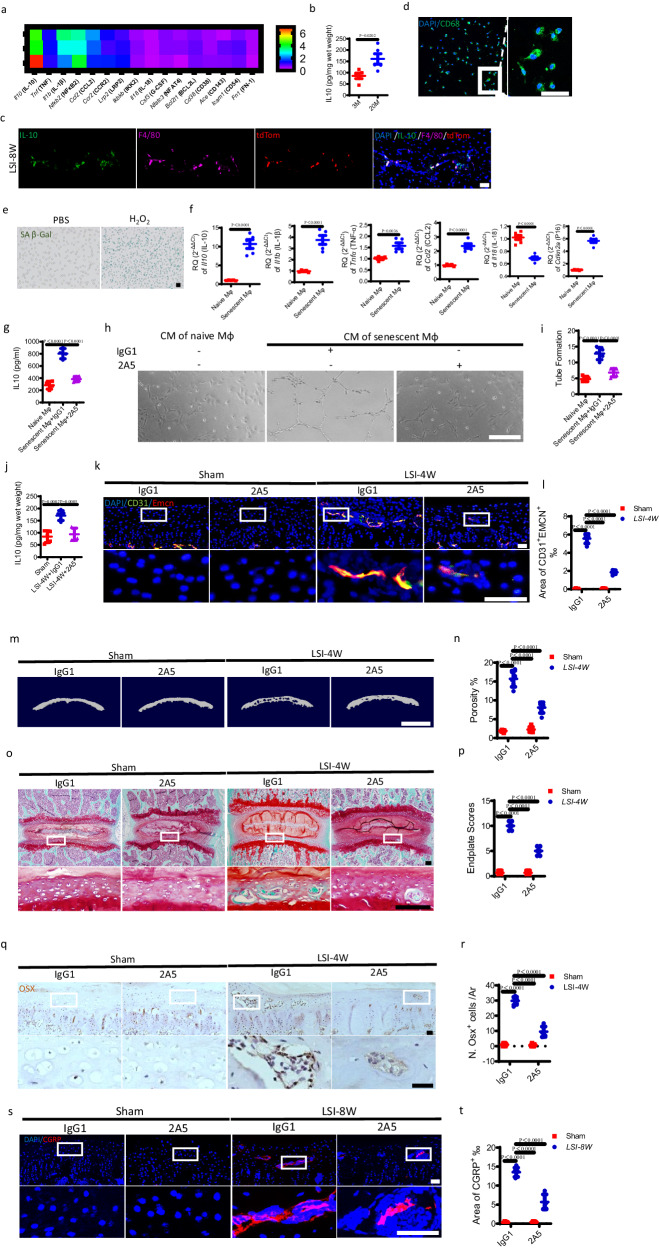
Fig. 9. IL-10 secreted by senescent-like macrophages contributes to angiogenesis in the degenerative endplates.
a Target mRNA expression levels of lumbar endplates from 20M mice or 3 M mice. Heatmap of top 10 dysregulated cytokines. b ELISA analysis of IL-10 concentration in the lysate of lumbar endplates from 20 M mice or 3 M mice. n = 5 per group. c Representative immunofluorescent images of tdTom (red), IL-10 (green), F4/80 (magenta) staining and DAPI (blue) staining of nuclei in the endplates at 8 weeks after LSI surgery in p16tdTom mice. Scale bars, 50 μm. d–f The primary BMDMs were harvested from WT mice and treated with 100 μM H2O2 or PBS for 4 h. d Representative images of immunofluorescent analysis of CD68 (green) staining and DAPI (blue) staining of nuclei in the BMDMs. Scale bars, 50 μm. e Representative images of BMDMs stained for SA-βGal (green). Scale bars, 50 μm. f The mRNA expression levels of Il10 (IL-10), Il1b (IL-1β), Tnfα (TNF-α), Ccl2 (CCL2), Il18 (IL-18), and Cdkn2a (P16) in BMDMs were determined using qRT-PCR. Each group consisted of n = 5 for Il10, Il1b, Tnfα, and Ccl2, while Il18 and Cdkn2a had n = 6 per group. g–i BMDMs were treated with H2O2 or PBS, plus IL-10-blocking mAb (2A5) or negative control (IgG1) administration. g ELISA analysis of IL-10 concentration in the lysate of BMDMs. n = 4 per group. h Representive tube formation images of endothelial cells treated with conditioned medium (CM) from BMDMS. Scale bars, 50 μm. i Quantitative analysis of tube formation of h. n = 5 per group. j–t LSI surgery mice or sham surgery mice were administrated with 2A5 or IgG1. j ELISA analysis of IL-10 concentration in the lysate of lumbar endplates. n = 5 per group. k Representative immunofluorescent images of CD31 (green), Emcn (red) staining and DAPI (blue) staining of nuclei in the endplates. Scale bars, 50 μm. l Permillage of CD31+Emcn+ area in endplates of k. n = 6 per group. m Representative µCT images of the caudal endplates of L4/5 (coronal view). Scale bars, 500 μm. n Quantitative analysis of the total porosity of m. n = 6 per group. o Representative images of safranin O and fast green staining of the endplates. Scale bars, 50 μm. p Endplate scores of o. n = 6 per group. q Representative immunohistochemical images of Osterix (Osx) in the endplates. Scale bars, 50 μm. r Quantitative analysis of the number of Osx+ cells in the endplates of q. n = 6 per group. s Representative immunofluorescent images of CGRP+ sensory nerves (red) and DAPI (blue) staining of nuclei in the endplates. Scale bars, 50 μm. t Permillage of CGRP+ area in the endplates of s. n = 6 per group. Data are represented as means ± standard deviations, as determined by two-tailed Student’s t test or One-way ANOVA. Source data are provided as a Source Data file.

