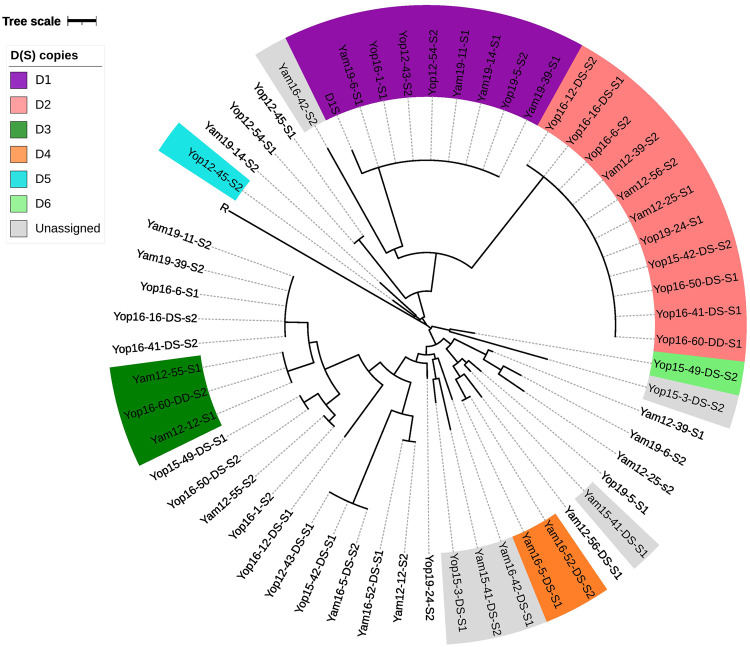
Fig. 2. Diversity of the ace-1 S and D(S) sequences in individuals displaying triple peaks.
This phylogram represents the diversity of the S copies retrieved (TA cloning/Sanger sequencing and/or Nanopore sequencing, see Supp. Info. Table 2) from individuals displaying triple peaks in the mix sequence of the “ace-1 resistance phenotype” PCR product (see Materials). Samples are coded as follows: locality (Yam for Yamoussoukro and Yop for Yopougon)/sampling year and individual number (-x). The 12 samples whose genotype was obtained through short-read sequencing are further coded with DS (duplicated heterozygote) or DD (duplicated homozygote). For each individual, the two S copies are indicated as copy S1 and copy S2 (assigned randomly). Sequences identified as single-copy S alleles are not highlighted. Copies identified as probable D(S) copies (see text) are highlighted according to the corresponding putative D allele (legend). Unassigned sequences, i.e. S sequences that are found in an individual carrying a D allele, but that cannot yet be assigned to S or D(S) for lack of data, are highlighted in grey. NB: the haplotypes assigned to D1(S), including the D1 controls, differed by one mutation from the canonical sequence (GenBank: KM875635.1).

