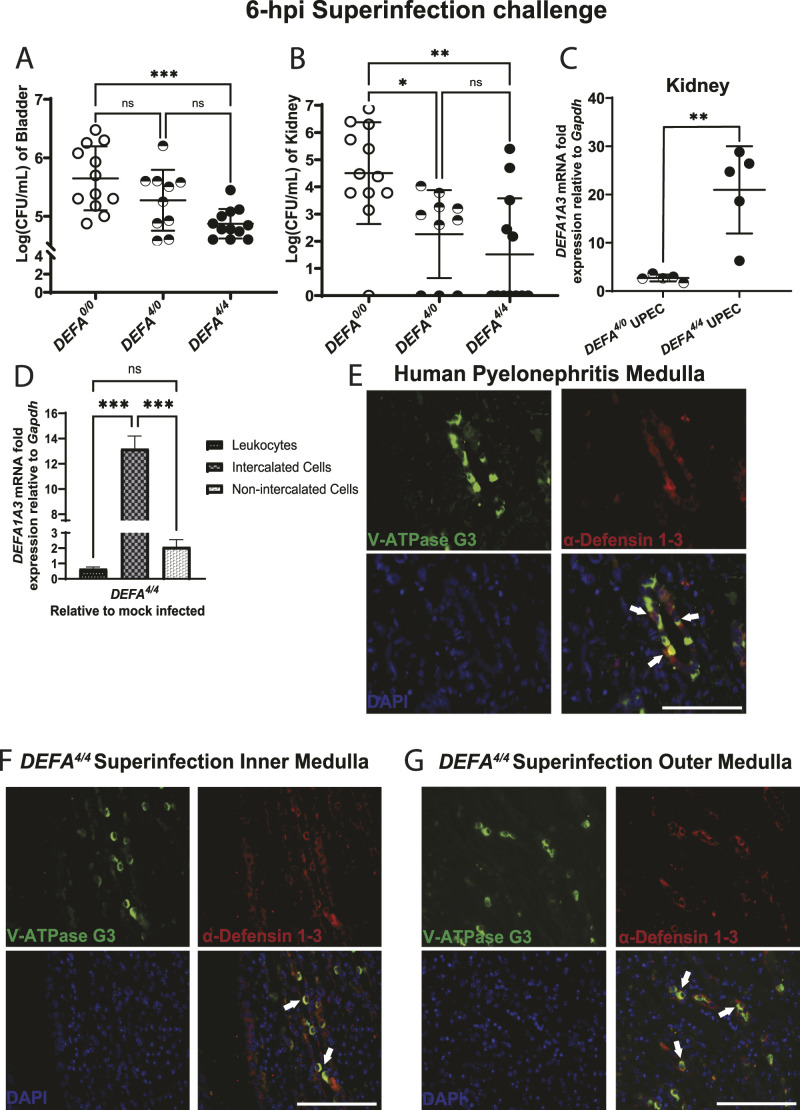
Figure 1. Human DEFA1A3 gene transgenic mice are protected against urinary tract infections in a gene dose–dependent manner.
(A, B) Quantified CFU/ml of (A) bladder and (B) pooled kidney lysates from infected mice with 0, 4, and 8 human DEFA1A3 gene copies after 6 h of uropathogenic Escherichia coli (UPEC); CFT073 superinfection challenges. Statistically, comparisons were analyzed using one-way ANOVA with Tukey’s post hoc test from 12 biological replicates per group. (C) Infected kidneys from DEFA4/0 and DEFA4/4 mice were compared for inducible DEFA1A3 mRNA expression levels. Data are represented as five individual biological replicates with the representation of the mean ± SD for each plot and compared with a t test. (D) Measurement of DEFA1A3 mRNA expression was performed in magnetic-sorted kidney-derived leukocytes (CD45+), intercalated cells (CD45−CD117+), and non-intercalated cells (CD45−CD117−) from mock and UPEC-challenged DEFA4/4 mice normalized to housekeeping Gapdh expression. Bar graphs are representative of the mean ± SD from the fold ratio of UPEC over mock-infected mice displaying mRNA expression from six total biological replicates and compared via one-way ANOVA and Tukey’s post hoc test. (E) Evaluation of human pyelonephritis kidney medulla sections stained for V-ATPase G3 (green), α-Defensin 1-3 (red), and nuclear DAPI (blue) immunofluorescence markers. (F, G) UPEC-infected DEFA4/4 mouse kidney sections representative of (F) inner and (G) outer medullary kidney regions are imaged for similar markers. Intercalated cells (V-ATPase G3+) expressing α-Defensin 1-3 were identified with white arrows. The scale bar represents 100 μm size for the respective section recorded under a 60X objective lens.

