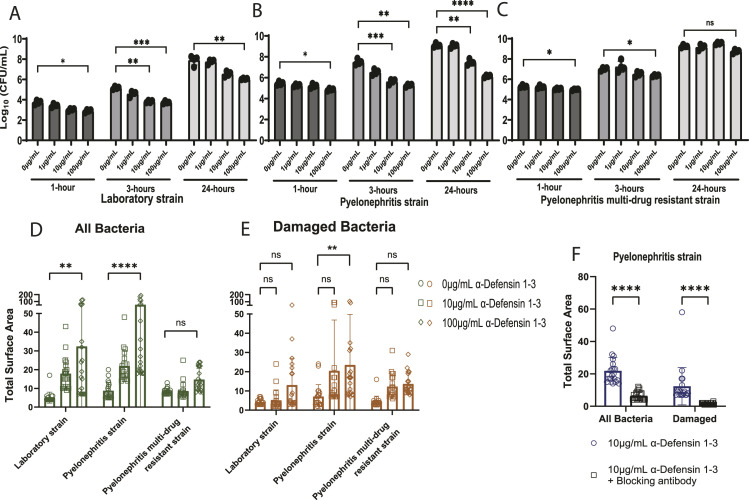
Figure 3. α-Defensin 1-3 induce dose-dependent bacterial membrane damage and cell agglutination of E. coli strains.
(A, B, C) Time-kill quantification of bacterial growth at increasing concentrations (1, 10, and 100 μg/ml) and co-incubation times (1, 3, and 24 h) for (A) laboratory E. coli strain; K12, (B) pyelonephritis strain; CFT073, and (C) pyelonephritis multi-drug–resistant uropathogenic E. coli strain; MDR58. The mean CFU/ml ± SD for duplicate technical replicates from two separate experiments is reflected in bar graphs. Bacterial co-incubations after 3 h at 37°C of co-incubation with the respective E. coli strain and various α-Defensin 1-3 peptide concentrations. (D, E) Total surface area of bacterial aggregates (μm2) quantified in (D) SYTO9 staining images to identify all bacteria and (E) PI staining images of damaged and dying E. coli aggregates. (F) Similarly, quantification of bacterial agglutination of all bacteria (left) and damaged bacteria (right) after co-incubation with (F) anti-α-Defensin 1-3 antibody and α-Defensin 1-3 peptides with pyelonephritis strain; CFT073. Two-way ANOVA with Sidak’s multiple comparison test was applied to analyze conditions.

