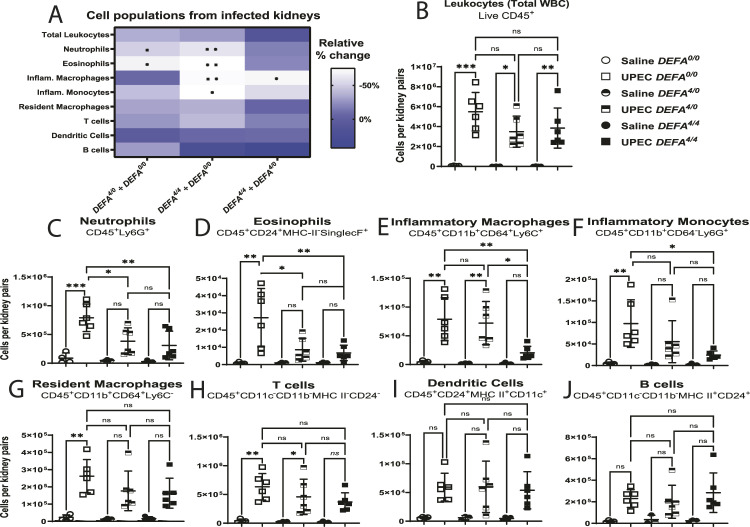
Figure 5. Human DEFA1A3 gene transgenic mouse copies determine differential recruitment of pro-inflammatory cell populations after uropathogenic E. coli infection.
(A) Relative percent change of immune cell populations was quantified to compare the responses between littermate DEFA0/0, DEFA4/0, and DEFA4/4 mice after 6 hpi. Significant differences are summarized with asterisk(s) for the respective genotype and cell population comparison. Scale denotes the relative percent (%) change of infected murine groups. (B, C, D, E, F, G, H, I, J) Total live leukocytes, (C) neutrophils, (D) eosinophils, (E) inflammatory macrophages, (F) inflammatory monocytes, (G) resident macrophages, (H) T lymphocytes, (I) dendritic cells, and (J) B lymphocytes from infected kidneys were counted and compared against each DEFA genotype. Asterisk(s) within each genotype comparison represent(s) significant statistical differences from one-way ANOVA and applied Tukey’s post hoc test for three to six biological replicates in the cell population assessed. No differences across immune populations were recorded in vehicle-challenged mice with 0, 4, and 8 DEFA1A3 copies. (E) Pro-inflammatory macrophages were only significantly impacted by comparing infected DEFA4/4 with DEFA4/0 kidneys. Data are represented as the mean ± SD of cell numbers gated from pooled kidney using expression markers according to labels in individual cell populations.

