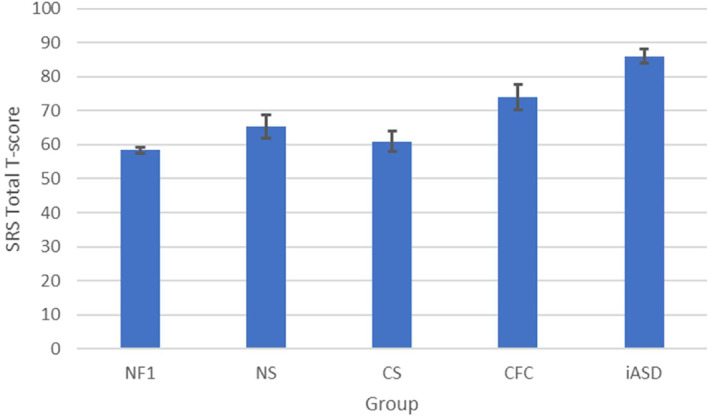
FIGURE 3.

SRS total T scores in different RASopathies and iASD comparison group. Error bars represent 95% confidence intervals. The scores for CFC, CS, and iASD have been adopted from Adviento et al. (2014). The score for NF1 has been calculated by pooling data from 8 studies (Chisholm et al., 2022; Huijbregts & de Sonneville, 2011; Lalancette et al., 2022; Lubbers et al., 2022; Morotti et al., 2021; Morris et al., 2016; Payne et al., 2020; van Eeghen et al., 2013). The score for NS has been calculated by pooling data from two studies (Adviento et al., 2014; Naylor et al., 2023). CFC, cardio‐facio‐cutaneous syndrome; CS, Costello syndrome; iASD, idiopathic autism spectrum disorder; NF1, neurofibromatosis type 1 regardless of ASD diagnosis; NF1+ASD, NF1 selected on ASD diagnosis; NS, Noonan syndrome; SRS, social responsiveness scale.
