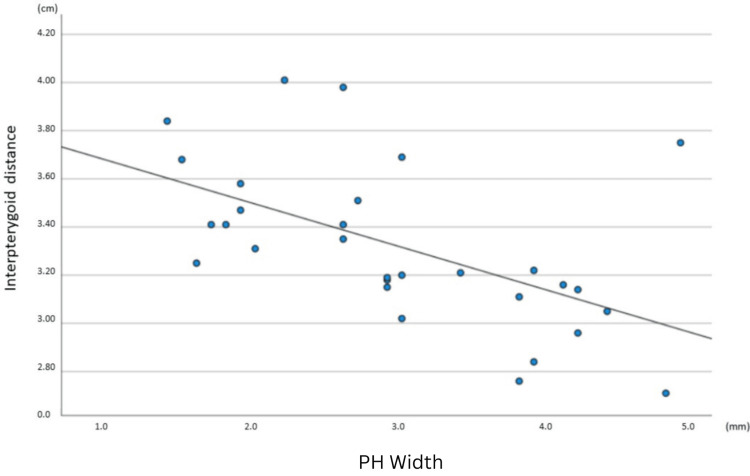
Figure 3. A scatterplot of interpterygoid distance vs. PH width for the sample of 30 skulls with intact bilateral PH.
Each dot represents the anatomic measurements of a single skull. Each point’s horizontal position indicates the interpterygoid distance (in cm) and the vertical position indicates the PH width (in mm). The line of best fit indicates the presence of a negative correlation (r = -0.555, p = 0.001).
PH: Pterygoid hamulus

