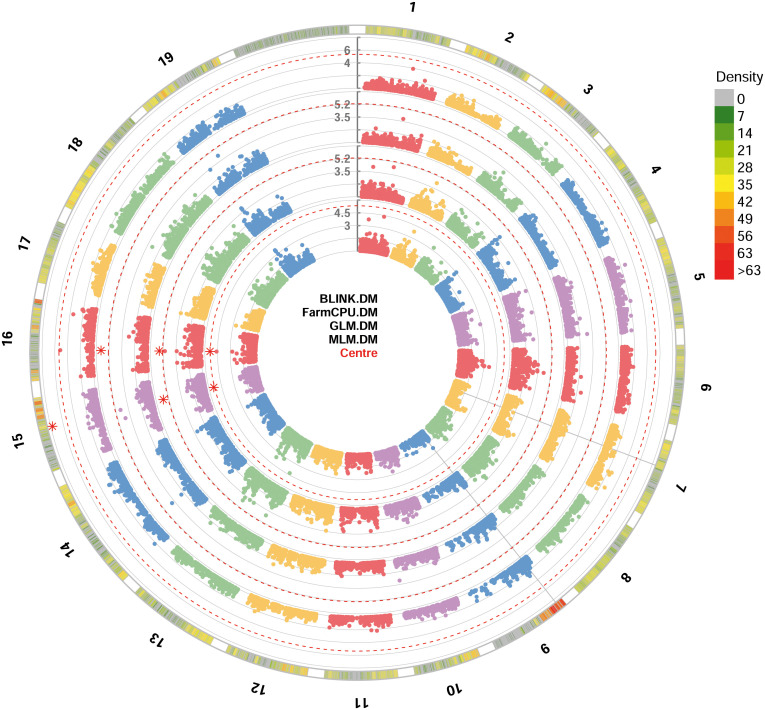
Figure 2.
Circular Manhattan plot of -log10 p-values estimated for binary (resistant vs. susceptible) coded phenotypic response to downy mildew (DM) in a panel of 88 cultivated and wild grapevine accessions genotyped by 18 k SNPs and subjected to GWAS. Significant SNPs are highlighted with a star above the Bonferroni-adjusted threshold (red dotted line). Association analysis results of BLINK, FarmCPU, MLM and GLM (from the outer to the inner circle) models from GAPIT.

