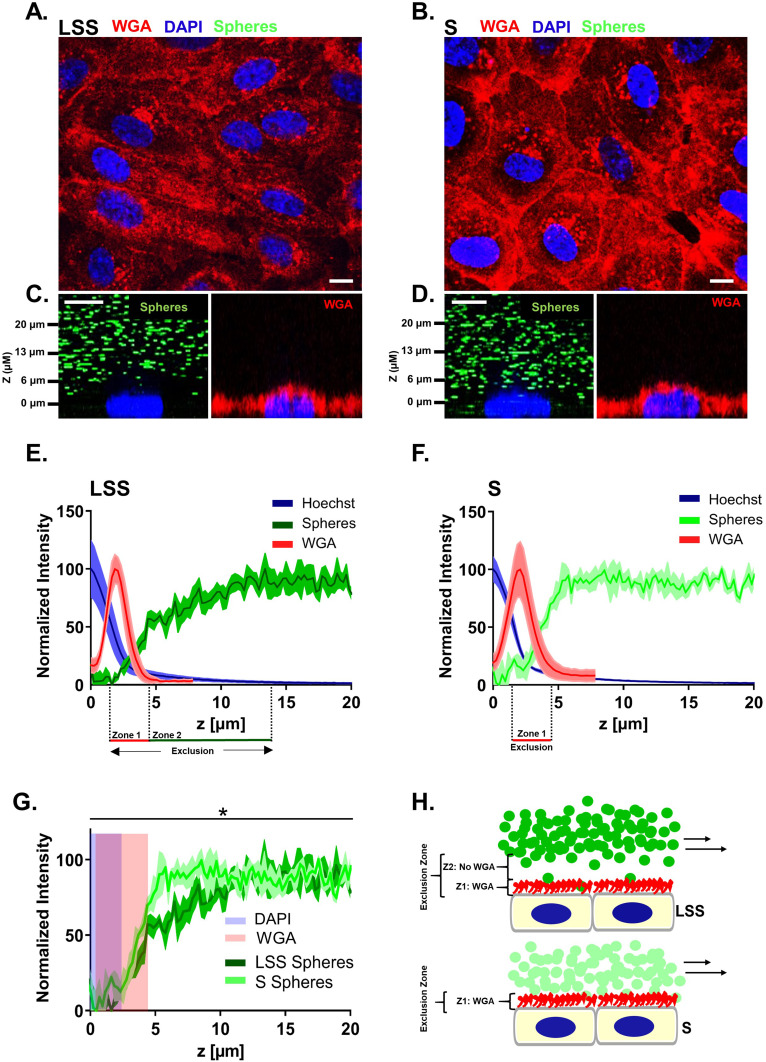
Figure 1.
The endothelial surface layer of endothelial cells cultivated under laminar shear stress contained an exclusion zone of several micrometers. Live HUVECs labeled by WGA (red) displaying the morphology after (A) LSS and (B) S cultivation for 72 h imaged by SDCM. Orthogonal images taken by SDCM of live (C) LSS- and (D) S- cultivated HUVECs perfused with passivated 1 µm-FluoSpheres (green) and afterwards labeled with WGA (red). (E-F) Graphs depict the mean WGA, Hoechst and FluoSphere signal over the z-dimension directly above the nuclei of live (E) LSS- and (F) S-cultivated HUVECs. (G) Line graph comparing mean FluoSphere signal in the ESL between LSS- and S-cultivated HUVECs over the z-dimension. Blue shading represents region with Hoechst signal and red shading WGA signal. Mean ± SEM; n = 3. Paired two-tailed t-test on the relative intensity increase of FluoSphere signal above the nucleus: *P < 0.05. X-axes begin at maximum Hoechst signal and end 20 µm above maximum Hoechst signal. (H) Schematic of particle exclusion conducted under perfusion in LSS- and S-cultivated HUVECs. Perfused FluoSpheres are shown in green. Red color represents the region labeled by WGA, zone 1, and blue the nucleus. Zone 1 (Z1) represents the region labeled by WGA and Zone 2 (Z2) the region not labeled by WGA. Scale bar = 10 µm.

