
FIG. 5.
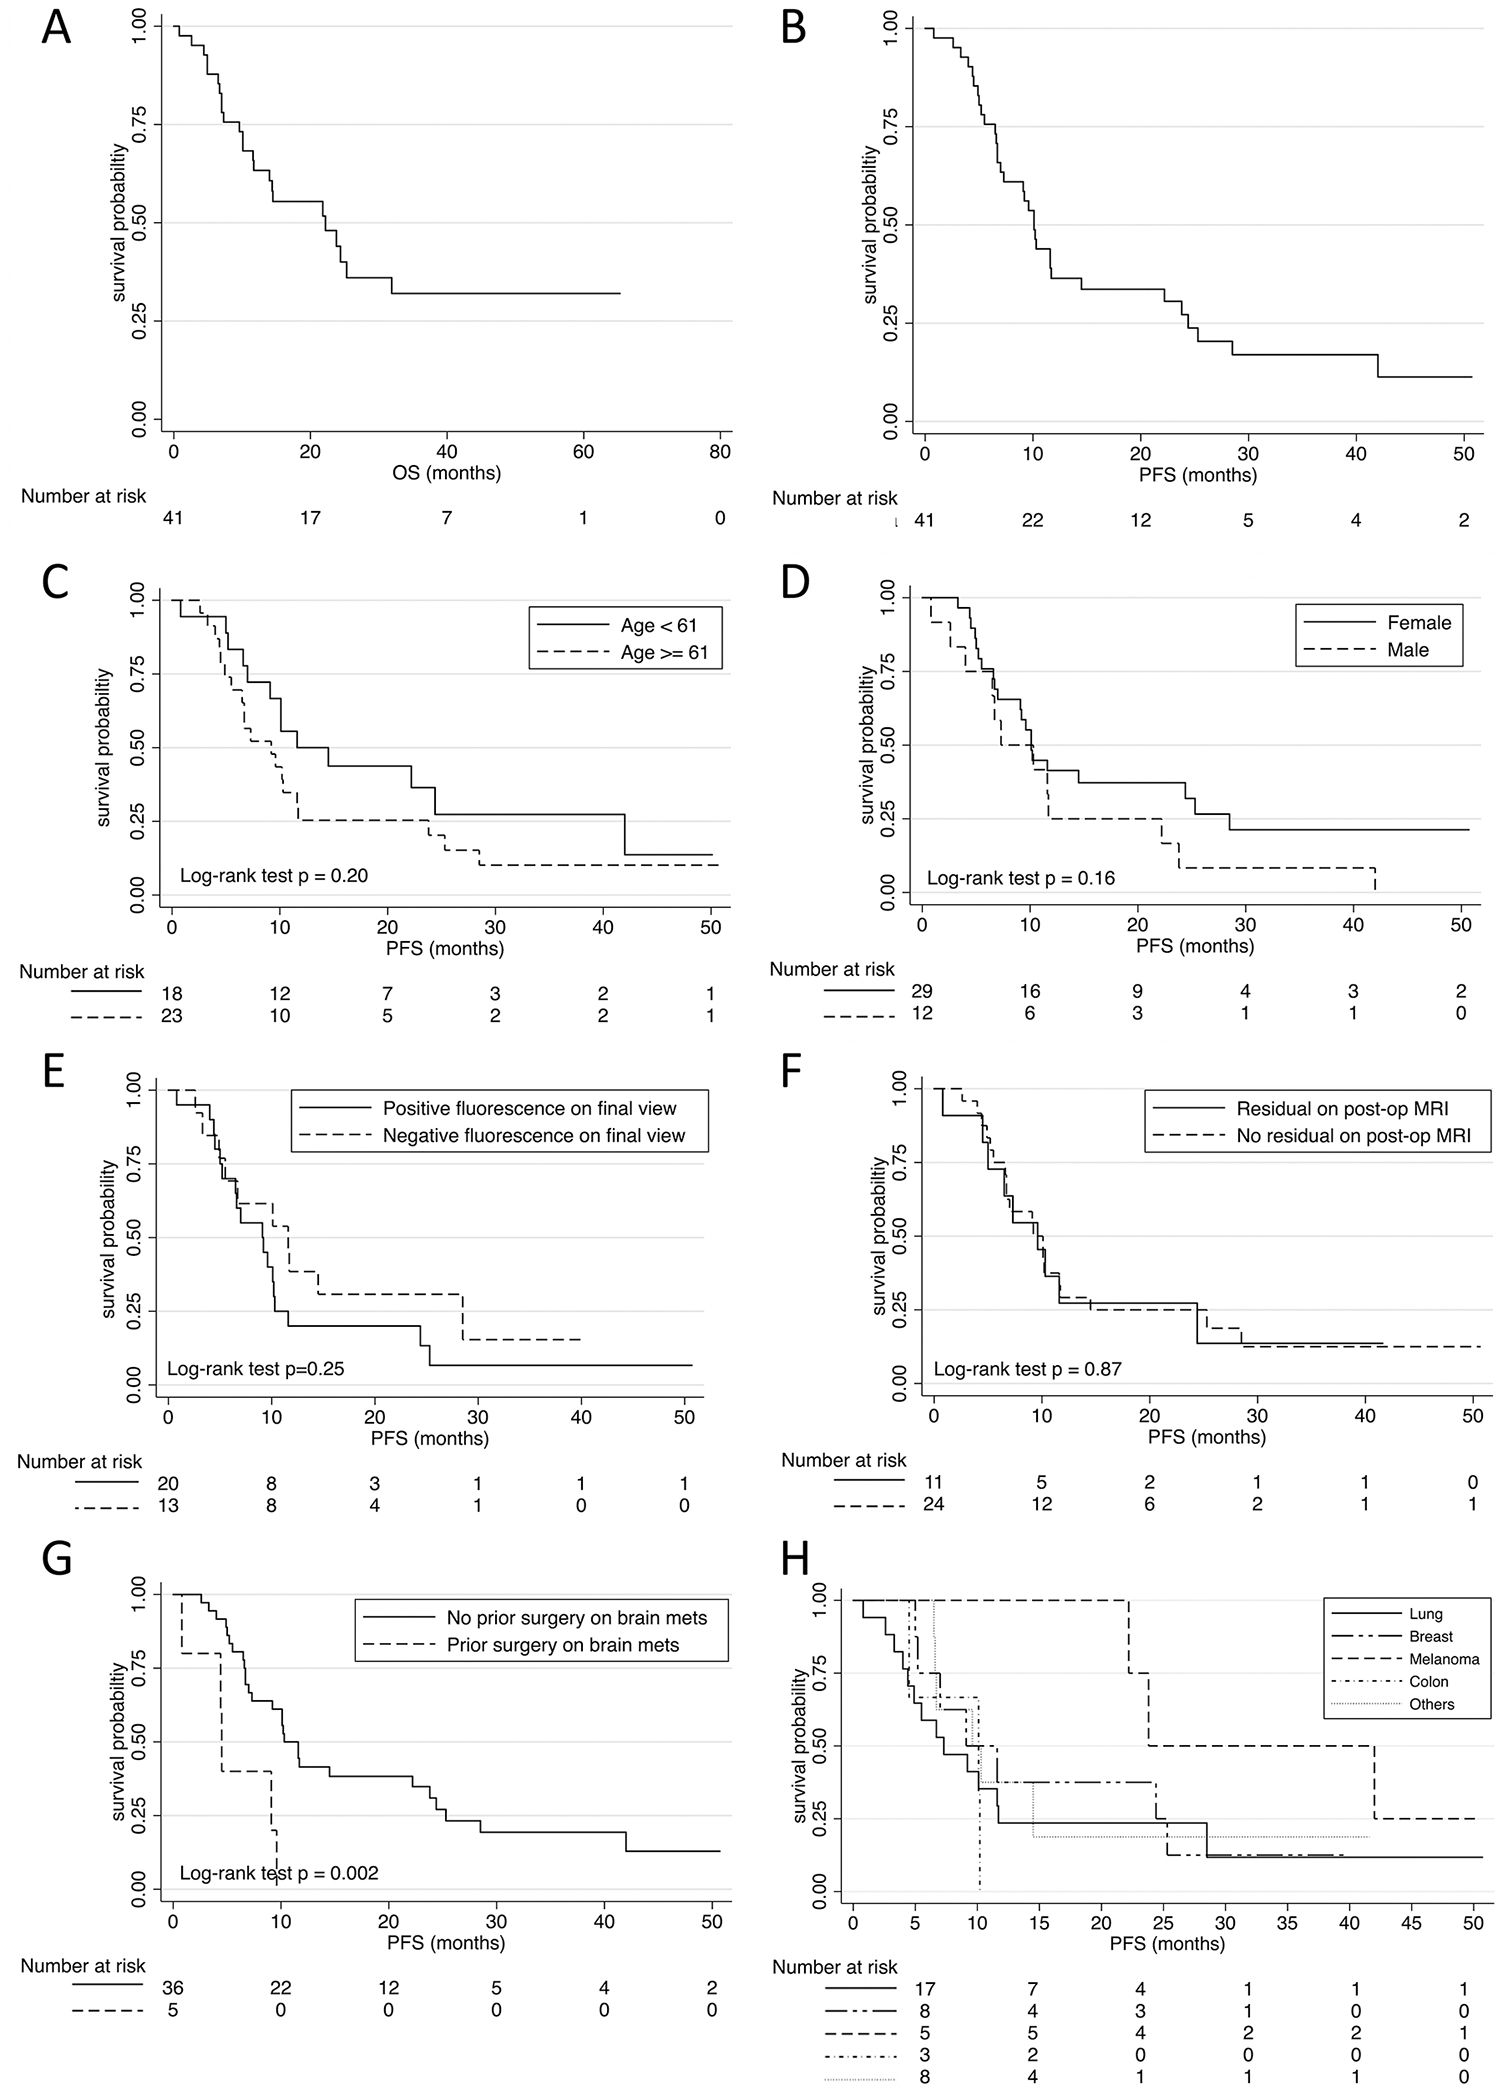
Kaplan-Meier survival curves. A: OR was 19 months (range 0.7–65.3 months). B: PFS was 15 months (range 0.7–50.7 months). C–H: PFS stratified by age (C), sex (D), NIR final view (E), postoperative MRI (F), prior surgery on BM (G), and primary pathology (H). mets = metastases.