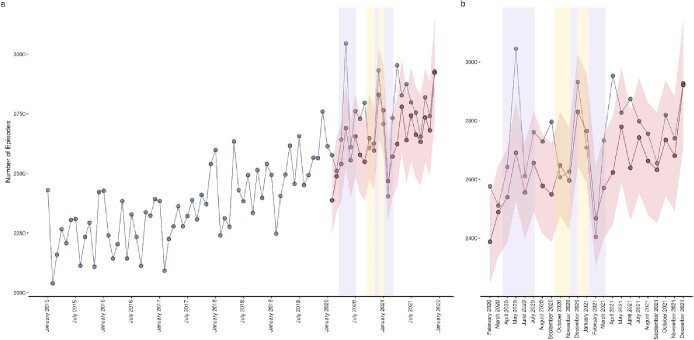
Figure 3.
Predicted versus observed falls and fractures in those with frailty (‘frail falls and fractures’). Blue data series indicate observed episodes, red data series indicate estimated episodes and their 95% confidence intervals, lilac shaded areas indicate periods of national lockdown restrictions and yellow shaded areas indicate periods of local tiered restrictions. (a) Provides a historical time series and pandemic year forecasts, (b) provides a pandemic year data only.

