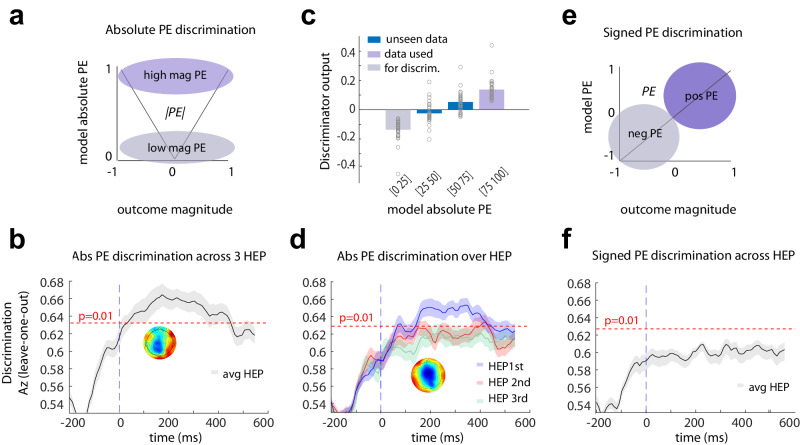
Fig. 3. Machine learning discrimination.
a Description of the data used for the absolute prediction error (PE) discrimination at time of outcome: we used the highest and lowest quantiles based on absolute PE (salience or surprise) as estimates for high and low absolute PE respectively. The analysis was performed on the HEP-locked EEG data. b Discriminator performance (cross-validated Area under the curve, Az) during absolute PE discrimination (low vs. high surprising outcomes), averaged across subjects (N = 32 participants). The dotted line represents the average Az value leading to a significance level of P = 0.01, estimated using a bootstrap test (two-sided). Shaded error bars are standard errors across subjects. This analysis used all first three HEP after outcomes. The scalp map represents the spatial topography of the absolute PE component. c Mean discriminator output (y) for the absolute PE component, binned in four quantiles based on model-based absolute PE estimates, showing a parametric response along the absolute PE dimension. Purple bins indicate trials used to train the classifier, while blue bins contain “unseen” data with intermediate absolute PE levels. Points are individual subjects. d The same analysis as in Fig. 3b (N = 32 participants) for each HEP after outcome. Blue represents the first heartbeat after outcome, red the second and green the third. The dotted line represents the average Az value leading to a significance level of P = 0.01, estimated using a bootstrap test (two-sided). Shaded error bars are standard errors across subjects. The scalp map represents the spatial topography of the absolute PE component. e Description of the data used for the signed PE discrimination: we used outcomes defined by the RL model as either positive or negative PEs. f Discriminator performance (cross-validated Az) during signed PE discrimination (positive versus negative PE), across all HEP after outcome, averaged across subjects (N = 32 participants). The dotted line represents the average Az value leading to a significance level of P = 0.01, estimated using a bootstrap test (two-sided). Shaded error bars are standard errors across subjects. No components were identified.

