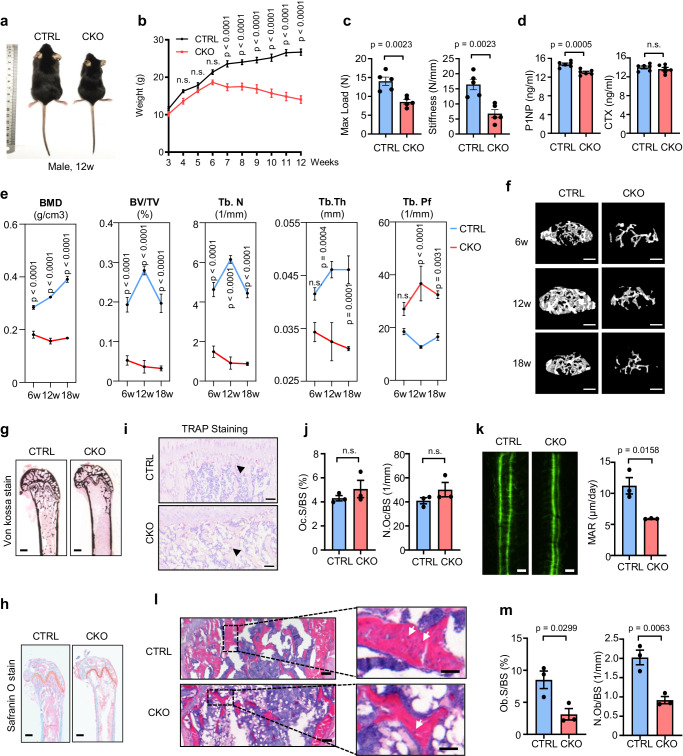
Fig. 6. Deletion of Hoip causes a reduced bone mass phenotype.
a Representative image of 8-week-old male HoiploxP/wt Osx-Cre+ (referred to as CTRL) HoiploxP/loxP Osx-Cre+ (referred to as CKO) mice. b Weight monitoring of HOIP CTRL and CKO mice. n = 5 per group. c Quantification of maximal loading and stiffness of humeral diaphysis from 8-week-old HOIP CTRL and CKO mice. n = 5 per group. d Serum levels of N-terminal propeptide of type I procollagen (PINP) and C-terminal telopeptide of collagen type 1 (CTX-1) from 8-week-old HOIP CTRL and CKO mice. n = 6 per group. e Histomorphometric analysis of trabecular bones from 6, 12,18-week-old HOIP CTRL and CKO mice, including bone mass density (BMD), bone volume per tissue volume (BV/TV), trabecular thickness (Tb.Th), trabecular number (Tb.N), trabecular spacing (Tb.Sp). n = 5 per group. f Representative micro-CT images of trabecular bones from 6, 12,18-week-old HOIP CTRL and CKO mice. Scale bars, 0.1 cm. g Von Kossa staining of femurs from 8-week-old HOIP CTRL and CKO mice. Scale bars, 0.2 mm. h Safranin O staining of femurs from 8-week-old HOIP CTRL and CKO mice. Scale bars, 0.2 mm. TRAP staining (i) of femurs from 8-week-old HOIP CTRL and CKO mice and quantification (j) of osteoclast surface/ millimeter of bone perimeter (Oc.BS) and osteoclast number/ millimeter of bone perimeter (N.Oc/BS) in (g). n = 3 per group, Scale bars, 50 μm. k Representative images of calcein double staining and quantitative analysis of mineralization apposition rate (MAR) of femurs from 8-week-old HOIP CTRL and CKO mice. n = 3 per group, Scale bars, 100 μm. l H&E staining of femurs from 8-week-old HOIP CTRL and CKO mice. Scale bars, 200 μm. m Quantitative analysis of osteoblast number/ millimeter of bone perimeter (N.Ob/BS) and osteoblast surface/ millimeter of bone perimeter (Ob.S/BS) in femurs from (l). n = 3 per group. All the data are shown as the mean ± SEM; p values are from the unpaired two-sided t-test and two-way ANOVA (Sidak’s multiple comparisons test). n.s., no significant. Source data are provided as a Source Data file.

