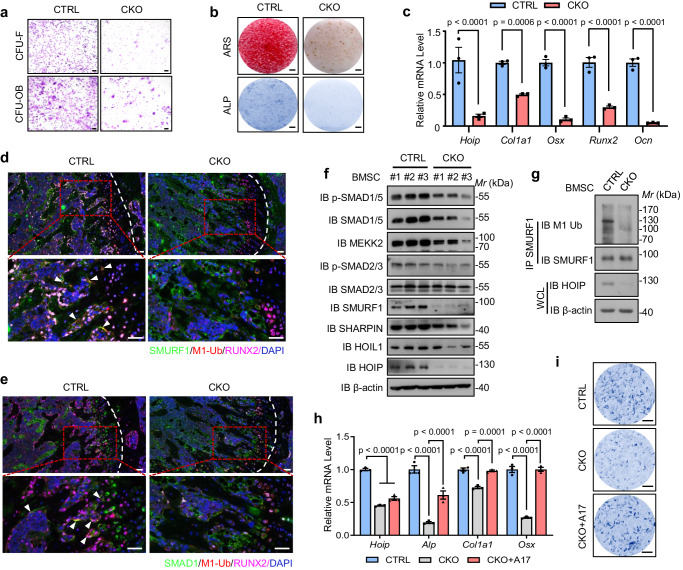
Fig. 7. SMURF1 inhibitor rescues the osteogenesis defects in HOIP knockout cells.
a Representative image of fibroblast colony-forming unit (CFU-F) and osteoblast colony-forming unit (CFU-Ob) of BMSCs from HoiploxP/wt Osx-Cre+ (referred to as CTRL) HoiploxP/loxP Osx-Cre+ (referred to as CKO) mice. Scale bars, 50 μm. b Representative images of alkaline phosphatase (ALP) staining and Alizarin red staining (ARS) of bone marrow mesenchymal stem cells (BMSCs) from HOIP CTRL and CKO mice after cultured in osteogenic medium for 14 and 28 days. Scale bars, 2 mm. c Quantitative RT-PCR analysis of osteogenesis genes mRNA levels in BMSCs from 8-week-old HOIP CTRL and CKO mice. n = 3 per group. d Immunohistochemical staining of linear ubiquitination, RUNX2 (the osteoblast cell marker) and SMURF1 in femurs from control and HOIP CKO mice. Scale bars, 50 μm. e Immunohistochemical staining of linear ubiquitination, RUNX2 and SMAD1 in femurs from control and HOIP CKO mice. Scale bars, 50 μm. f Immunoblot of SMURF1 and its substrates SMAD1/5, MEKK2 in BMSCs from HOIP CTRL and CKO mice. g Immunoprecipitates of SMURF1 linear ubiquitination in BMSCs from HOIP CTRL and CKO mice. h Quantitative RT-PCR analysis of osteogenesis genes mRNA levels in BMSCs from CTRL, CKO and CKO treated with SMURF1 inhibitor A17 groups for 28 days. n = 3 per group. i Representative images of ALP staining of BMSCs from CTRL, CKO and CKO treated with SMURF1 inhibitor A17 groups for 14 days. Scale bars, 0.5 mm. All the data are shown as the mean ± SEM; p values are from the two-way ANOVA (Sidak’s multiple comparisons test). Source data are provided as a Source Data file.

