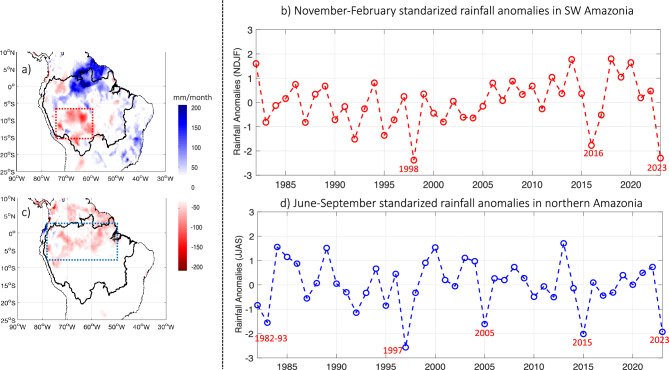
Figure 2.
(a) Rainfall anomalies for November-February 2022–23 (in mm/month) and (b) 1982–2023 standardized rainfall anomalies during the November–February season averaged over the southwestern Amazon Basin (8° S–15° S and 60° W–75° W; dotted red line in panel (a). In (b) The X axis corresponds to the year of the last month of the November-February season. (c) Rainfall anomalies for June–September 2023 (in mm/month) and (d) 1982–2023 standardized rainfall anomalies during the June–September season averaged over the Northern Amazon Basin (8° S–2.5° N and 50° W–75° W; dotted blue line in panel (c). In (a, c) anomalies are computed considering the 1982–2020 climatological period and only anomalies higher (lower) than 25 mm/day (− 25 mm/day) are plotted. Data visualisations produced using Matlab 2023b (https://matlab.mathworks.com).

