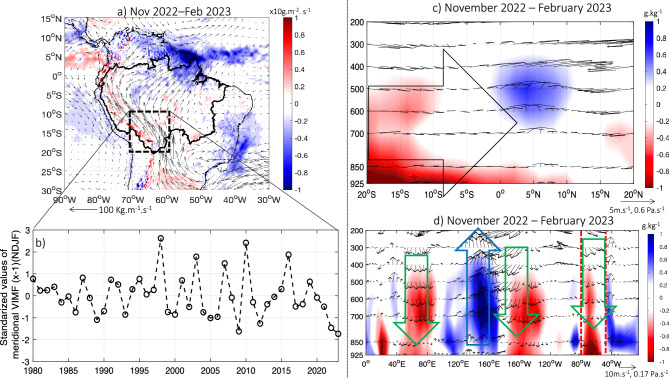
Figure 4.
(a) Anomalies of vertically integrated water vapor flux (vectors) and its divergence (colors) during November 2022 to February 2023. Only anomalies of divergence of vertically integrated water vapor flux higher (lower) than 0.1 are plotted. (b) November (n − 1)—February (n) temporal evolution of the meridional component of the vertical integrated moisture flux (VIMF; standardized values multiplied by − 1 or VIMFx-1) in the region 10° S–20° S and 71° W–60° W (black box in panel (a) for the period 1980–2023 period. (c) November 2022–February 2023 anomalies of specific humidity (colors) and meridional-vertical wind (vector) in a latitude–pressure level cross section averaged between 75 and 50° W. (d) November 2022–February 2023 anomalies of the specific humidity (colors) and zonal-vertical wind (vector) in a longitude–pressure level cross section between 10 and 20° S. Anomalies are computed considering the 1982–2020 climatological period. Black arrow in (b) outlines zones with predominance of southern wind anomalies. Green (blue) arrow in (c, d) outlines zones characterized by atmospheric downward motion (upward motion) anomalies. Only anomalies of the specific humidity higher (lower) than 0.2 g/kg (− 0.2 g/kg) are plotted. Red vertical lines in (d) indicate the boundaries of the Amazon basin (75° W–50° W). Data visualisations produced using Matlab 2023b (https://matlab.mathworks.com).

