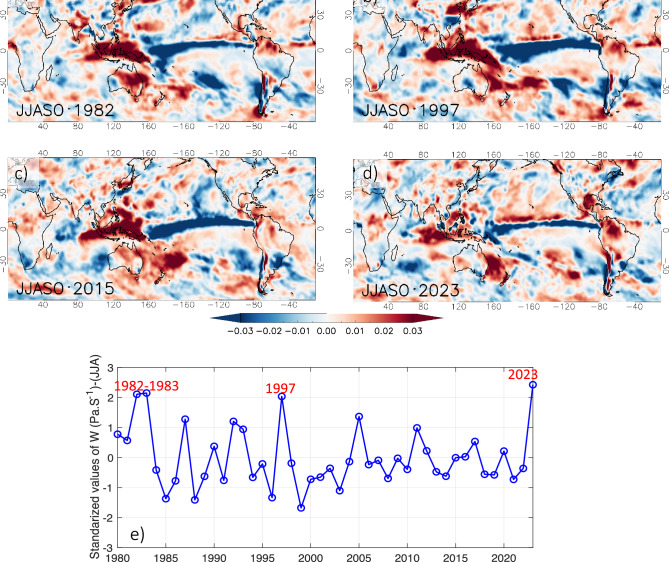
Figure 6.
Anomalies of vertical velocity w (Pa/s) at 500 hPa for the season June to October (JJASO) during the four major El Niños: (a) 1982, (b) 1997, (c) 2015 and (d) 2023. (e) 1980-2023 standardized values of vertical velocity averaged over the northern Amazonia (5° N–5° S; 50° W–75° W; dotted black box on Fig. 5b). Data visualisations for panels (a–d) produced using IDL v8 (https://www.nv5geospatialsoftware.com/Products/IDL). Data visualisations for panel (e) produced using Matlab 2023b (https://matlab.mathworks.com).

