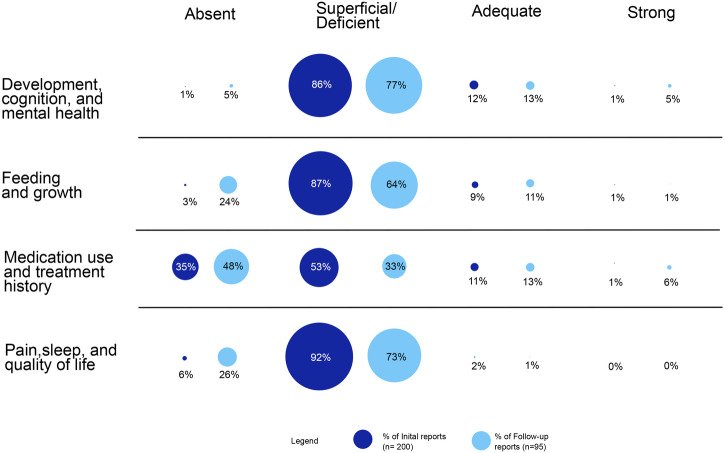
Fig. 1. Global qualitative assessments of the reporting of phenotype details germane to Domains I–IV.
For each of the four rating categories, the percentage of the initial reports (n = 200) are depicted in dark blue and of the follow-up reports (n = 95) in light blue. There were no significant differences in the distribution of overall quality ratings between the initial and follow-up reports, for any of the domains (Fisher’s exact tests, p > 0.05). See text for details.

