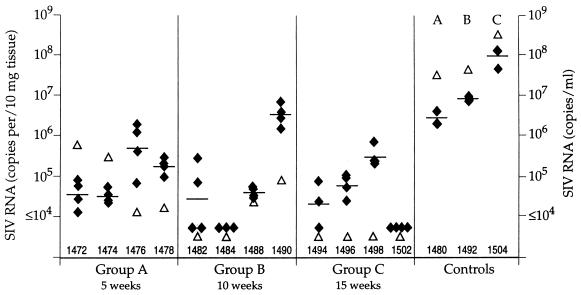
FIG. 2.
Comparison of SIV RNA in the plasma (▵) and lymph nodes (⧫) 2 weeks after challenge with SIVmac251. Lymph node biopsy samples were collected, and the tissues were divided into quadruplicate samples. SIV copy number was determined for each sample by bDNA assay, and the data were normalized per 10 mg of tissue. Individual data points, as well as the geometric mean, are presented for the quadruplicate samples. Paired plasma samples were analyzed for SIV RNA, and the data are expressed as SIV copies per ml. Data for controls depict the results obtained for the nonimmunized animals in each challenge group.

