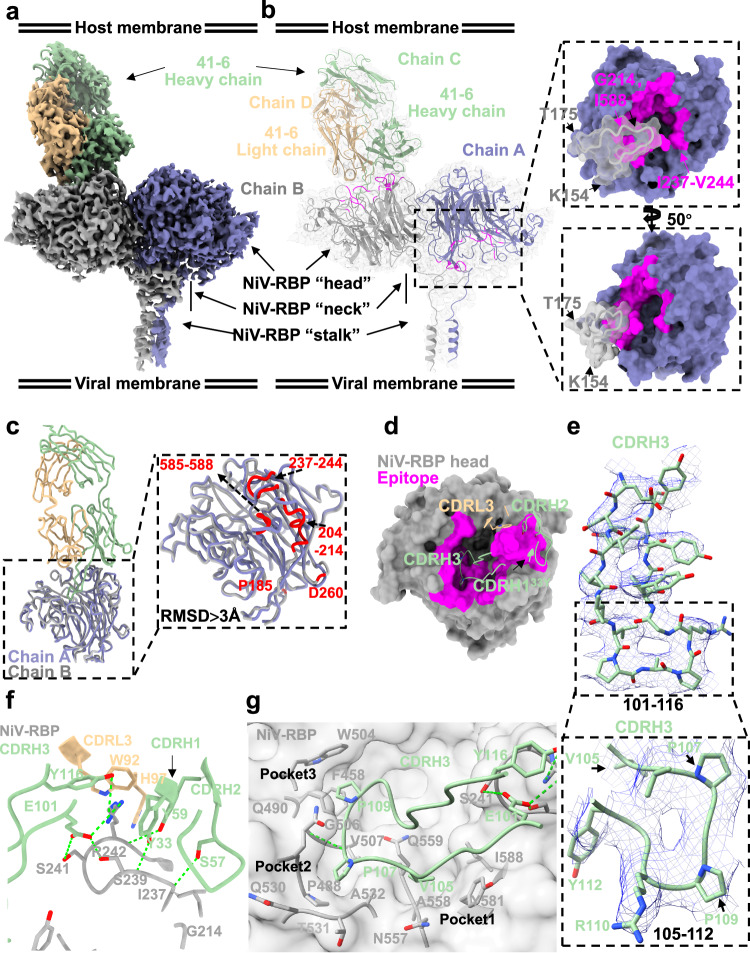
Fig. 6. Structure of NiV-RBP in complex with the 41-6 neutralizing Ab.
a Cryo-EM structure of the NiV-RBP ectodomain in complex with the neutralizing antibody 41-6 Fab fragment (41-6) represented by Cryo-EM map. Each of the NiV-RBP protomers is shown in a different color. 41-6 heavy and light chains are green and tan, respectively. b Interface of NiV-RBP with 41-6 in complex, which is shown as a model fitted into the density map. Left, interaction epitope between NiV-RBP protomers and 41-6. The epitope of NiV-RBP (Chain A) presumed by docking into NiV-RBP with the 41-6 complex is shown in magenta. Right, a zoomed-in view of the interaction between NiV-RBP dimers. c Superimposition of the NiV-RBP protomer with and without 41-6 from the above complex, shown as colored ribbon diagrams, NiV-RBP protomer (gray) with 41-6 indicated Chain B, adjacent protomer (medium slate blue) without 41-6 indicated Chain A. Right, zoomed-in comparison of Cα trace of NiV-RBP head between Chain A and Chain B. Regions with the highest deviations (RMSD >3 Å) between Chain A and Chain B are colored red. d Interaction analysis between the NiV-RBP head and 41-6. NiV-RBPs are shown as molecular surfaces. 41-6-VH: CDR1, CDR2, CDR3; 41-6-VL: CDR1, CDR2, CDR3, and FR-L3, which from each Fab are shown as different colored as ribbon diagrams. e Zoomed-in view of 41-6 CDRH3 densities map fit with a stick model, shown key residues binding with NiV-RBP, three residues (V105, P107, P109) insert into different pockets, respectively. f Zoomed-in view of interaction analysis of NiV-RBP with 41-6. 41-6 and NiV-RBP are shown as ribbon diagrams, colored green (heavy chain), tan (light chain), and gray, respectively. Critical contact residues are shown as sticks. Oxygen and nitrogen atoms are colored red and blue, respectively. Hydrogen bonds are shown as green dotted lines. g Interaction of NiV-RBP with 41-6-VH-CDR3. NiV-RBP is shown as a transparent molecular surface colored by gray, 41-6-VH-CDR3 is shown as a ribbon, and critical contact residues are shown as sticks. Oxygen and nitrogen atoms are colored red and blue, respectively. Hydrogen bonds are shown as green dotted lines.

