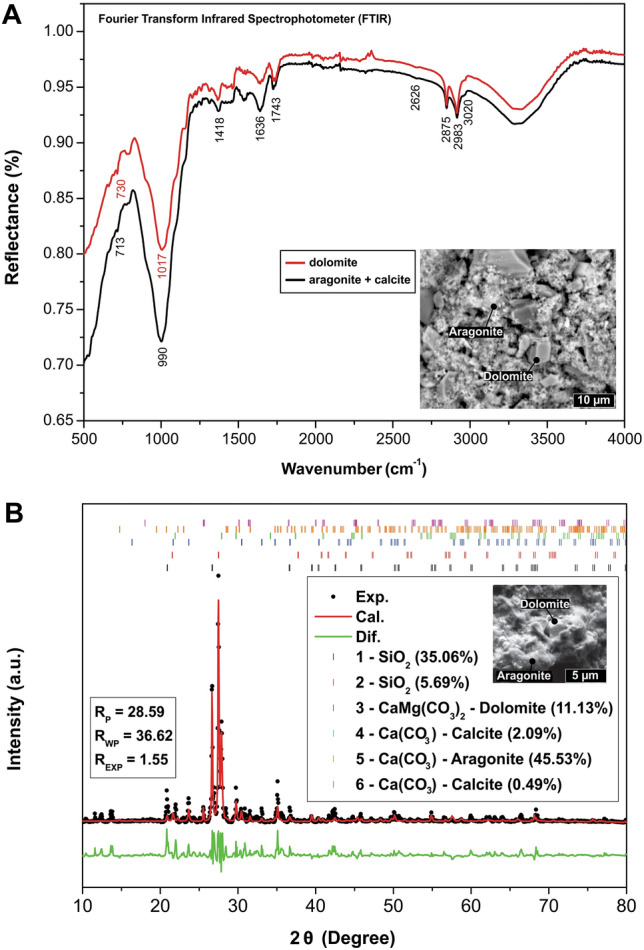
Figure 8.

(A) FTIR spectra of precipitate formed by aragonite and dolomite. The absorption features at 3020, 2626 and 730 cm−1 are characteristic of dolomite, whereas the other absorption values are characteristics of combined calcite-aragonite and dolomite33,34. The strong absorption bands observed at 1017–990 cm−1 may be associated with glass-fiber wool fragments in the precipitate (*fragments of glass wool used to immobilize the basalt grains were found with the mineral precipitate). (B) X-ray diffractogram of the CO2 precipitate. The black balls represent the experimental points, the solid red line represents the refinement obtained using the Rietveld method, and the solid green line represents the difference between the experimental points and the fit. The bars represent the Bragg angles for the phases found. RP, RWP and REXP represent the goodness of fit.
