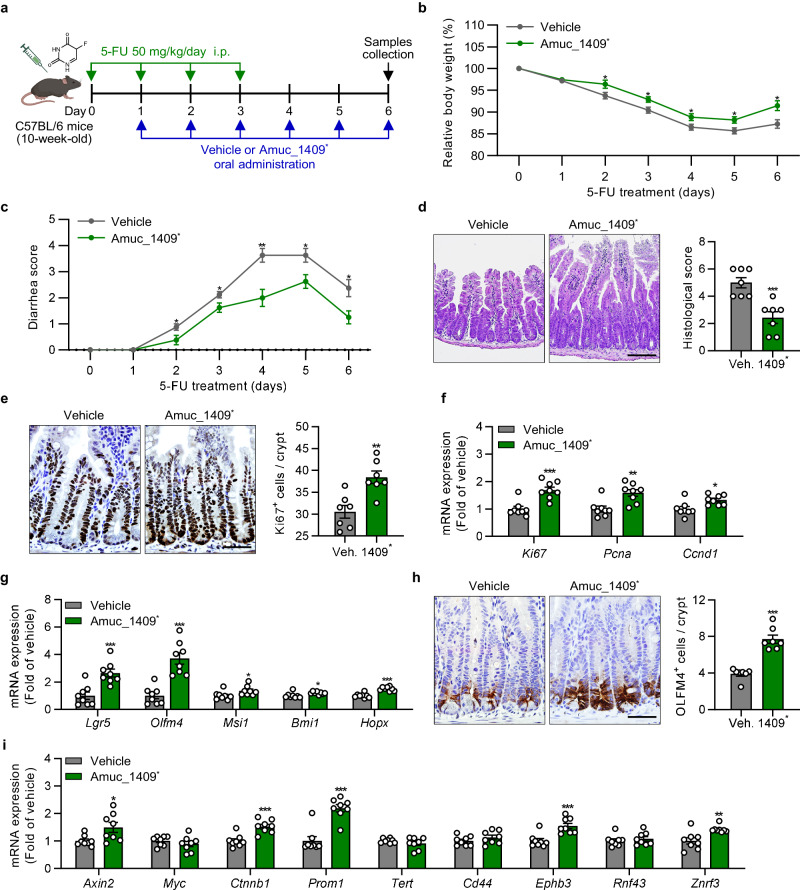
Fig. 5. Amuc_1409 treatment improves 5-FU-induced gut injury by promoting ISC regeneration.
a Scheme showing the experimental workflow for oral administration of vehicle or Amuc_1409* (9 μg per mouse) in the mice injected intraperitoneally (i.p.) with 5-FU (50 mg/kg/day). Assessment of the effect of Amuc_1409* on 5-FU-induced changes in body weight (b) and diarrhea (c) in mice. Body weight changes are expressed as a percentage of body weight relative to that on the day of the first 5-FU injection (day 0). d Representative images of H&E staining (left panel) and histological scores (right panel) in sections of SI. Scale bar, 100 μm. e Representative images of IHC staining for Ki67 (left panel) and quantification of Ki67+ cells per crypt (right panel) in sections of SI tissues. Scale bar, 50 μm. f qRT-PCR results showing the relative mRNA expression of cell proliferation markers (Ki67, Pcna, and Ccnd1) in SI tissues. g qRT-PCR analysis of the relative mRNA expression of ISC markers (Lgr5, Olfm4, Msi1, Bmi1, and Hopx) in SI tissues. h Representative images of IHC staining for OLFM4 (left panel) and quantification of OLFM4+ cells per crypt (right panel) in SI sections. Scale bar, 50 μm. i qRT-PCR results showing the relative mRNA expression of Wnt/β-catenin target genes in SI tissues. All data are presented as the mean ± SEM. Data shown in (b–i) are representative of three independent experiments, each with similar results. Each data point represents a biological replicate, corresponding to one mouse (b, c, f, g, i: n = 8 biological replicate mice per group, d, e, h: n = 7 biological replicate mice per group). Images in (a) were created with BioRender.com and have been granted a publication license. The chemical structure in (a) was created with ChemDraw. Statistical analyses were performed using two-tailed Student’s t test (b–i) (*p < 0.05, **p < 0.01, and ***p < 0.001 vs vehicle-treated group). Source data, including the exact p values, are provided as a Source Data file.

