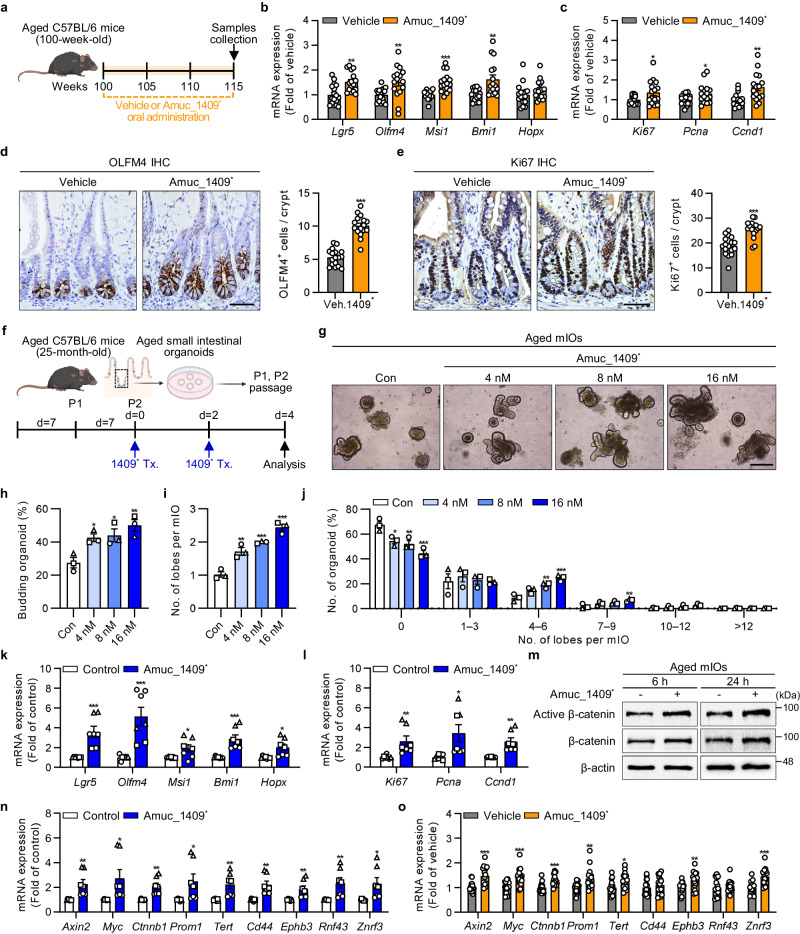
Fig. 6. Amuc_1409 augments the aging-induced decrease in ISC number and function.
a Scheme for Amuc_1409* (4.5 μg/mouse) treatment in natural aging mice model. Relative mRNA expression of ISC (b) and cell proliferation (c) markers in aged SI. Representative IHC images for OLFM4 (d, left panel) and Ki67 (e, left panel), and quantification of OLFM4+ cells (d, right panel) and Ki67+ cells (e, right panel) per crypt in aged SI. Scale bar, 50 μm. f Scheme for Amuc_1409* treatment (Tx.) in aged mIOs. Representative brightfield images (g), percentage of budding organoids (h), number of lobes per mIO (i), and percentage distribution of organoids with the indicated number of lobes per mIO (j) in aged mIOs. Scale bar, 200 μm. Relative mRNA expression of ISC (k) and cell proliferation (l) markers in Amuc_1409* (16 nM)-treated aged mIOs. m Immunoblot analysis of active β-catenin and total β-catenin in aged mIOs treated with Amuc_1409* (16 nM) for indicated time points before harvest. n Relative expression of Wnt/β-catenin target genes in Amuc_1409* (16 nM)-treated aged mIOs. o Relative expression of Wnt/β-catenin target genes in aged SI. All data are presented as the mean ± SEM. In (b–e) and (o), each data point represents a biological replicate, corresponding to one mouse (vehicle, n = 17; Amuc_1409*, n = 16 biological replicate mice). Data are combined from two independent experiments. In (h–l) and (n), a different symbol indicates a data point representing each biological replicate from independently established organoid lines derived from distinct mouse litters (n = 3 biologically independent mice). In (k, l), and (n), each biological replicate includes two or three technical replicates. Images in (a) and (f) were created with BioRender.com under a granted publication license. Statistical analyses were performed using one-way ANOVA with Dunnett’s multiple comparisons test (h, i, j) and two-tailed Student’s t test (b–e, k, l, n, o) (*p < 0.05, **p < 0.01, and ***p < 0.001 vs control group). Source data, including the exact p values and uncropped western blot images, are provided as a Source Data file.

