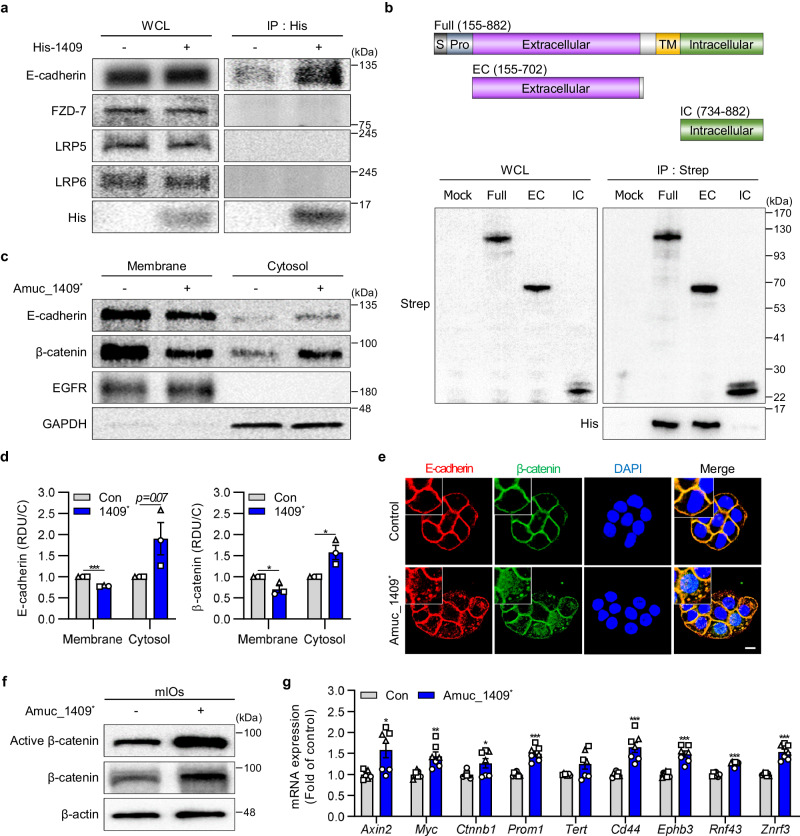
Fig. 7. Amuc_1409 induces dissociation of β-catenin from E-cadherin, resulting in the activation of Wnt/β-catenin signaling.
a Results after WCLs from HT-29 cells incubated with or without purified His-tagged Amuc_1409 protein (Amuc_1409*, 0.5 μg) for 1 h were subjected to immunoprecipitation using His-antibodies, followed by immunoblotting with indicated antibodies. b Schematics of the domain constructs of E-cadherin (upper panel); HEK293T cells were transfected with Strep-tagged E-cadherin domain constructs, and WCLs were subjected to a Strep pull-down assay. Immunoprecipitates were incubated with Amuc_1409* (20 μg), followed by immunoblotting with indicated antibodies (lower panel). Data are representative of three independent experiments. Representative immunoblot images (c) and relative quantitative analysis for E-cadherin (d, left panel) and β-catenin (d, right panel) of the membrane and cytosolic fractions from HT-29 cells treated with Amuc_1409* (16 nM) for 30 min. The quantification data are expressed as relative densitometer units with respect to the control group of each fraction (RDU/C). Epidermal growth factor receptor (EGFR) and GAPDH were used as loading controls for the membrane and cytosol, respectively. The blots shown are representative of three independent experiments. e Representative images of IF staining for E-cadherin and β-catenin in HT-29 cells treated with Amuc_1409* (16 nM) for 30 min. E-cadherin (red); β-catenin (green), DAPI (nuclei, blue). Scale bar, 10 μm. Immunoblot analysis of active and total β-catenin (f) and relative mRNA expression of Wnt/β-catenin target genes (g) in young mIOs treated with Amuc_1409* (16 nM) for 30 min before harvest. In (g), a different symbol indicates a data point representing each biological replicate from independently established organoid lines derived from distinct mouse litters (n = 3 biologically independent mice). Each biological replicate includes two or three technical replicates. All data are presented as the mean ± SEM. Data shown are representative of two independent experiments, each with similar results unless otherwise stated. Statistical analyses were performed using two-tailed Student’s t test (d, g) (*p < 0.05, **p < 0.01, and ***p < 0.001 vs control group). Source data, including the exact p values and uncropped western blot images, are provided as a Source Data file.

