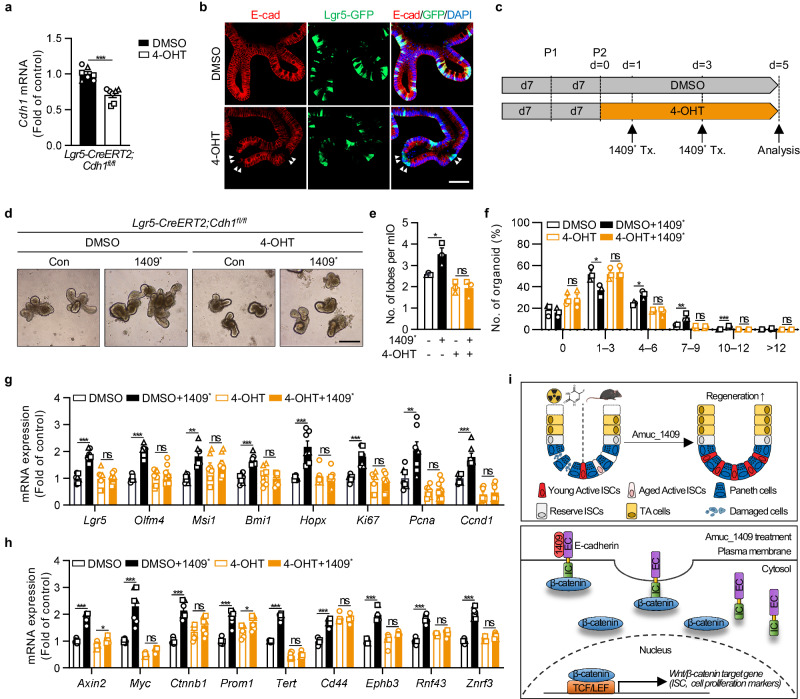
Fig. 8. Amuc_1409 enhances the regenerative function of ISCs in an E-cadherin-dependent manner.
qRT-PCR results showing the relative Cdh1 (E-cadherin gene) mRNA expression (a) and representative IF staining for E-cadherin and GFP (b) to confirm the Cdh1 deletion in GFP-expressing Lgr5+ ISCs in mIOs from Lgr5-CreERT2;Cdh1fl/fl mice at day 5 after 4-OHT addition began. The specific deletion of E-cadherin in GFP-expressing Lgr5+ ISC is indicated by the white arrowheads. Scale bar, 50 μm. c Diagram showing the 4-OHT (1 μM) and Amuc_1409* (16 nM) treatment (Tx.) schedule in mIOs from the SI crypt of Lgr5-CreERT2;Cdh1fl/fl mice. mIOs were analyzed on day 5 after either DMSO (vehicle control) or 4-OHT addition began. Representative brightfield images (d), assessment of the number of lobes per mIO (e), and the percentage distribution of organoids with the indicated number of lobes per mIO (f) in mIOs from Lgr5-CreERT2;Cdh1fl/fl mice treated with or without Amuc_1409*. Scale bar, 200 μm. qRT-PCR results showing the relative mRNA expression of ISC markers (Lgr5, Olfm4, Msi1, Bmi1, and Hopx), cell proliferation markers (Ki67, Pcna, and Ccnd1) (g), and Wnt/β-catenin target genes (h) in mIOs from Lgr5-CreERT2;Cdh1fl/fl mice treated with or without Amuc_1409*. i Schematic summary of the role of Amuc_1409 in ISC-mediated intestinal regeneration during irradiated- or 5-FU-induced intestinal injury and aging. The illustration was created with BioRender.com and has been granted a publication license. The chemical structure was created with ChemDraw. All data are presented as the mean ± SEM. In (a) and (e–h), a different symbol indicates a data point representing each biological replicate from independently established organoid lines derived from distinct mouse litters (n = 3 biologically independent mice). In (a, g, and h), each biological replicate includes two or three technical replicates. Statistical analyses were performed using two-tailed Student’s t-test (a) and one-way ANOVA with Dunnett’s multiple comparisons test (e–h) (ns, not statistically significant, *p < 0.05, **p < 0.01, and ***p < 0.001 vs control group). Source data, including the exact p-values, are provided as a Source Data file.

