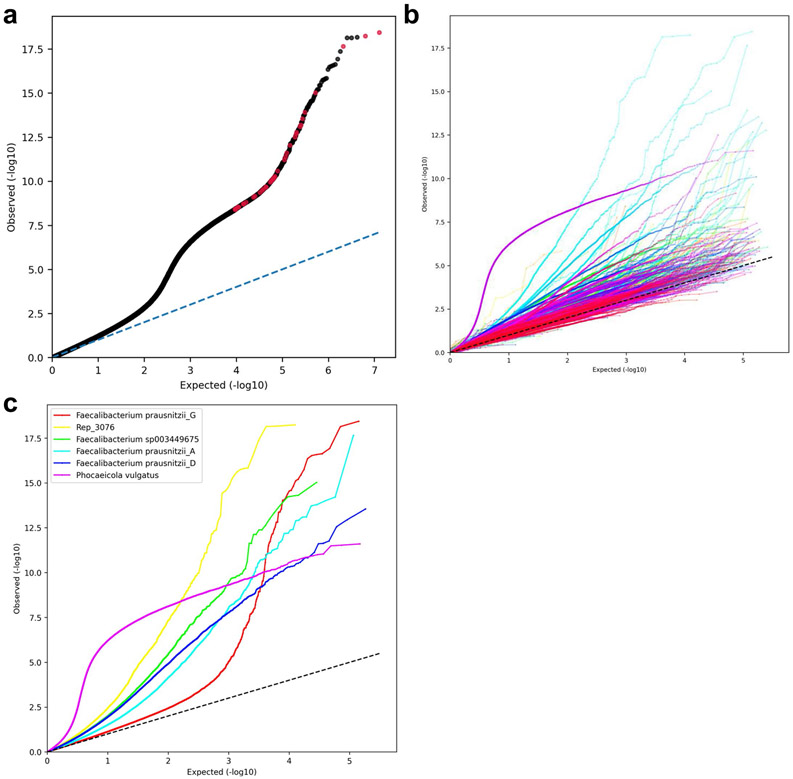
Extended Data Fig. 4 ∣. Quantile-quantile (Q-Q) plots.
Expected (uniform distribution between 1/[the total number of tested SNPs] and 1) p-values compared to the SNPs p-values estimated in the MWAS analysis. (a) All tested SNPs. Red dots are the 40 BMI-associated SNPs remaining after the clumping procedure. (b) Each species estimated and plotted separately using a random color. Straight lines connect adjacent SNP dots to increase readability. (c) Species with more than 13 BMI-associated SNPs. Straight lines connect adjacent SNP dots to increase readability.

