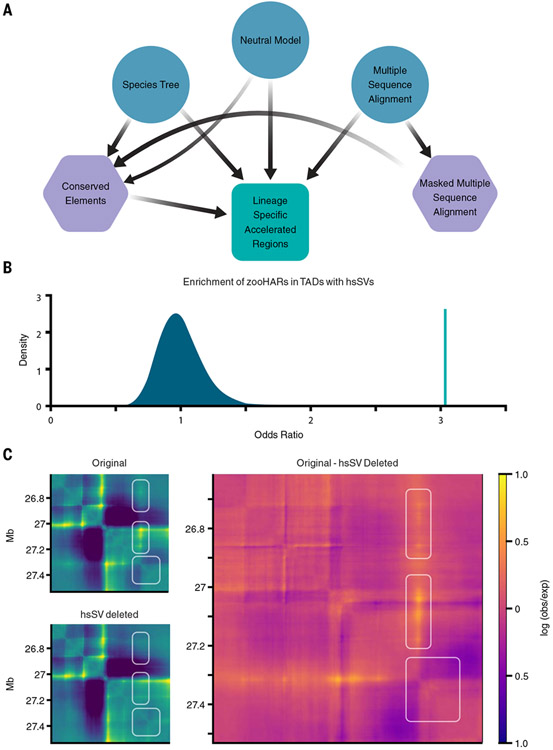
Fig. 1. hsSVs are enriched in zooHAR chromatin domains and predicted to change the 3D genome.
(A) Pipeline to identify lineage-specific accelerated regions. Blue circles indicate initial input data, purple hexagons are intermediate results, and the green square is the final output. (B) Odds ratio of chromatin contact domains in GM12878 cells (33) containing hsSVs and zooHARs (green line) compared with a null distribution (shaded blue region) of odds ratios for chromatin contact domains containing conserved (phastCons) elements and hsSVs from 1000 random draws of phastCons equaling the number of zooHARs. (C) Akita prediction of a locus [hg38.chr4:26614489-27531993; hsSV, human-specific insertion hsSV1 from (23, 30)] with a human-specific insertion (Original), with the human-specific insertion deleted in silico (hsSV deleted), and a subtraction matrix (Original - hsSV deleted) comparing the chromatin contact matrices with and without the human-specific insertion. White boxes indicate regions that change in the original compared with the hsSV deleted sequences. Log(observed/expected) contact values are shown in the heatmaps.

