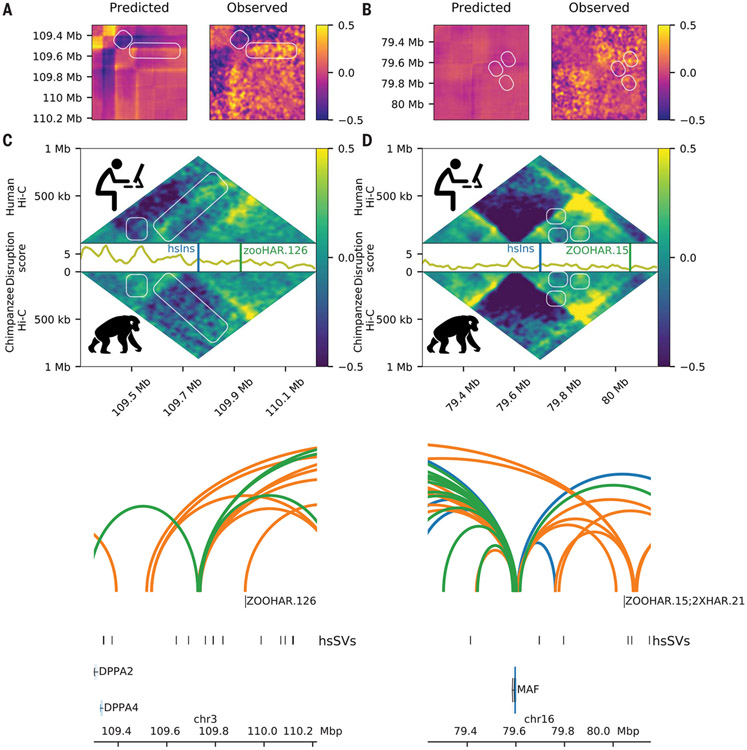
Fig. 2. hsSVs change the 3D genome around zooHARs and zooCHARs.
White boxes highlight differences between the species. Log(observed/expected) values are shown in the heatmaps. (A and B) Subtraction matrices for the in silico predicted change due to the human-specific insertion (left) and observed chromatin contact maps in human compared with chimpanzee NPC Hi-C (right) for the loci containing zooHAR.126 [hg38.chr4:26614489-27531993; hsSV1 from (23, 30)] and zooHAR.15 [hg38.chr16:79237694-80155198; hsSV2 from (23, 30)], respectively. (C and D) Human (top) and chimpanzee (bottom) log (observed/expected) Hi-C contact frequencies in each locus, with the disruption score (10-kb resolution) in between. (E and F) zooHAR locations denoted by vertical lines adjacent to their names. Conserved (blue), chimpanzee-specific (green), and human-specific (orange) loops are shown [5-kb resolution, loops called with Mustache (44)].

