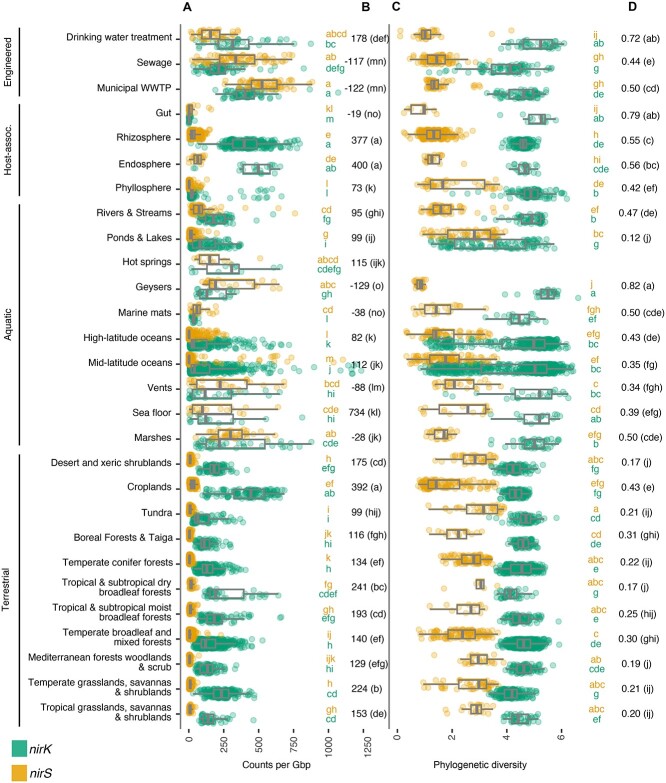
Figure 7.
Abundance and diversity of nir genes in metagenomes across biomes. A) Abundance of nirK and nirS genes per gigabase (Gb) sequenced, with B) median difference in nirK and nirS abundance (δnir). C) Diversity of nirK and nirS genes based on balance-weighted phylogenetic diversity (BWPD), with D) median ratios of nirK:nirS diversity. Ecosystem classifications are shown to the left. Biomes were compared using Benjamini-Hochberg FDR-corrected pairwise ranked comparisons following Kruskall-Wallis. Shared letters denoting similar abundance (in A) or diversity (in C) between biomes are shaded by nir type. Biomes represented by fewer than 10 metagenomes were excluded from the figure. Metagenomes off the scale of the axis are not shown but included in calculations for boxplot and pairwise comparisons. Boxplots show median and quartiles, and whiskers show 95 percentiles, and values for individual samples are shown as points.

