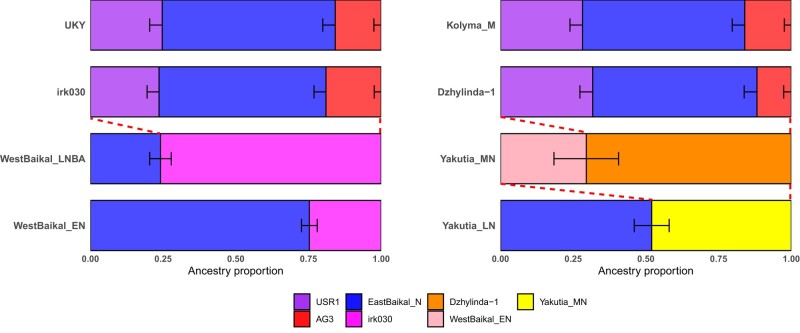
Fig. 2.
The genetic profiles of ancient Siberians estimated by qpAdm. Target populations are modeled as a mixture of two or three populations. The ancestry proportion of each source is represented by the box size on the x axis. Horizontal bars represent ±1 SE estimated by qpAdm using 5 cM block jackknifing. Detailed results are presented in supplementary tables S4 and S5, Supplementary Material online.

