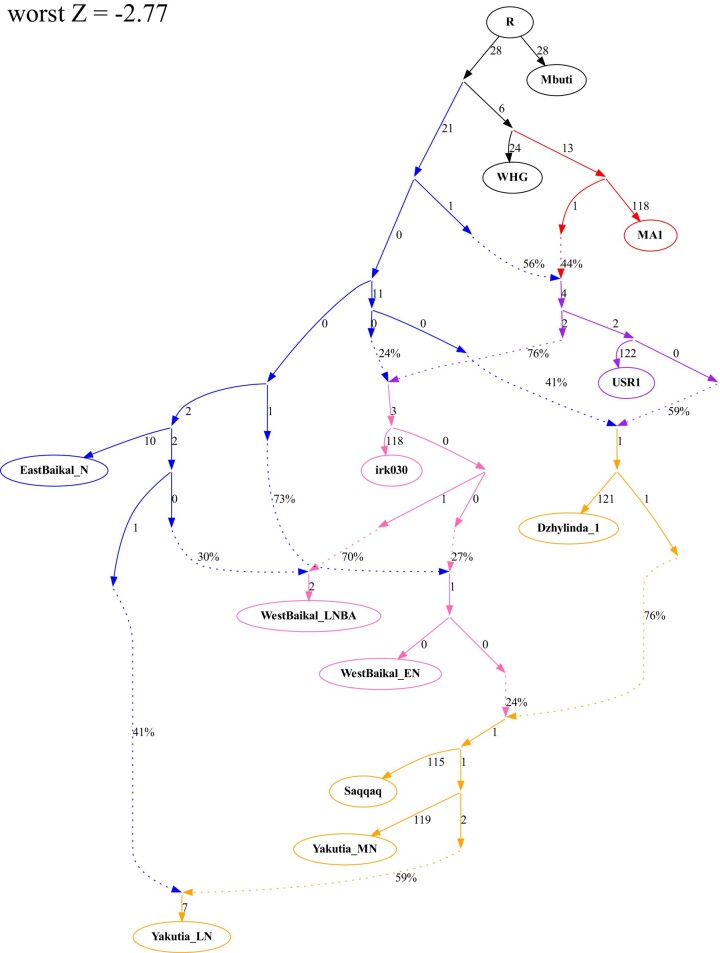
Fig. 3.
Manually fitted admixture graph explaining population dynamics of ancient Siberian populations. The admixture graph is based on proximal admixture modeling results and manually fitted by qpGraph function. ANE, ANA, Native American, West Baikal, and Yakutia lineages are shown in red, blue, purple, light pink, and yellow, respectively. The worst Z-score between fitted and observed f4 statistics is −2.77.

